Pheatmap骚操作之提取聚类后的基因集
如题就是记录解决如何从已经用 pheatmap 包中提取已聚类后的基因列表。
1.构建基因聚类的热图
1.1 构建测试数据
测试数据是直接复制参考资料中的代码,其中名字稍作改动并添加了基因的分组信息。
edata <- matrix(rnorm(200), 20, 10)
edata[1:10, seq(1, 10, 2)] <- edata[1:10, seq(1, 10, 2)] + 3
edata[11:20, seq(2, 10, 2)] <- edata[11:20, seq(2, 10, 2)] + 2
edata[15:20, seq(2, 10, 2)] <- edata[15:20, seq(2, 10, 2)] + 4
colnames(edata) = paste("Test", 1:10, sep = "")
rownames(edata) = paste("Gene", 1:20, sep = "")

pdata <- data.frame(row.names = rownames(edata),
                    gene = rownames(edata),
                    group = paste('group',c(rep(1,5),rep(2,5),rep(3,5),rep(4,5)),sep = '_'))
1.2 画热图
annotation_row <- data.frame(row.names = rownames(edata),
                             Group = pdata$group)

ancols.Group <- c('#e41a1c','#377eb8','#4daf4a','#984ea3')
names(ancols.Group) <- unique(pdata$group)

ann_colors <- list(Group = ancols.Group)

pheatmap(edata,border_color=NA,color = colorRampPalette(c("blue", "white", "red"))(100),
         scale = "row",cutree_rows = 2,
         cluster_row = T,cluster_col = T,show_rownames=T,show_colnames=T,
         clustering_distance_rows = "euclidean",clustering_method='complete',
         annotation_row=annotation_row,annotation_colors=ann_colors,
         fontsize=7,width = 6, height = 6,
         filename = "heatmap.scale.row.pdf"
)
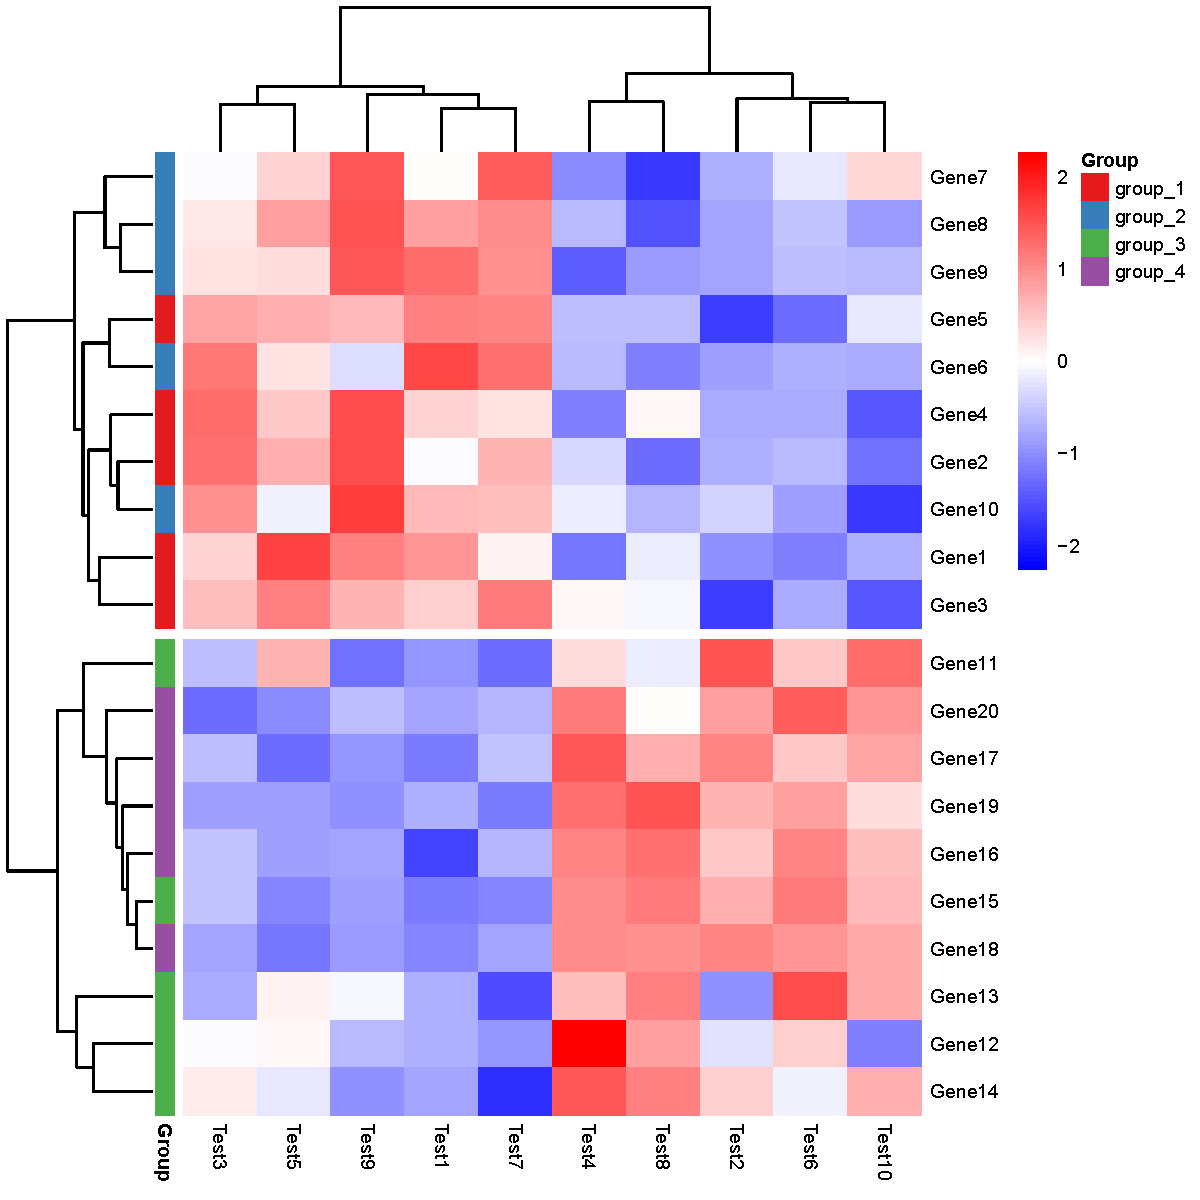
至此,获得如下所示的热图。

想要完全的复现出来,需要注意以下几个参数:
- scale: 对行进行了标准化
- cluster_row: 对行进行了聚类
- cluster_row: 对行进行了聚类
- clustering_distance_rows: 行聚类距离计算方法是 euclidean
- clustering_method: 行聚类的方法是 complete
- cutree_rows: 行聚类后,根据聚类结果将行划分为 2 部分
2.提取热图中聚类后的基因分组信息
按照前面所说的几个参数,依次实现后即可获得所需信息。
2.1 scale data by row
scale_rows <- function (x) {
  m = apply(x, 1, mean, na.rm = T)
  s = apply(x, 1, sd, na.rm = T)
  return((x - m)/s)
}
mat = switch('row', none = edata, row = scale_rows(edata), column = t(scale_rows(t(edata))))
2.2 cluster row
d = dist(mat, method = 'euclidean')
tree = hclust(d, method = 'complete')
2.3 cut tree
v = cutree(tree, 2)[tree$order]
gaps = which((v[-1] - v[-length(v)]) != 0)
2.4 get cluster gene data
gene.cluster <- as.data.frame(v)
gene.cluster$gene <- str_split(rownames(gene.cluster),'[.]',simplify = T)[,1]
经过上面四个步骤,gene.cluster 就是所需的聚类后的分类结果,也就是说这个表里面的顺序和最开始聚类后的热图是一致的。
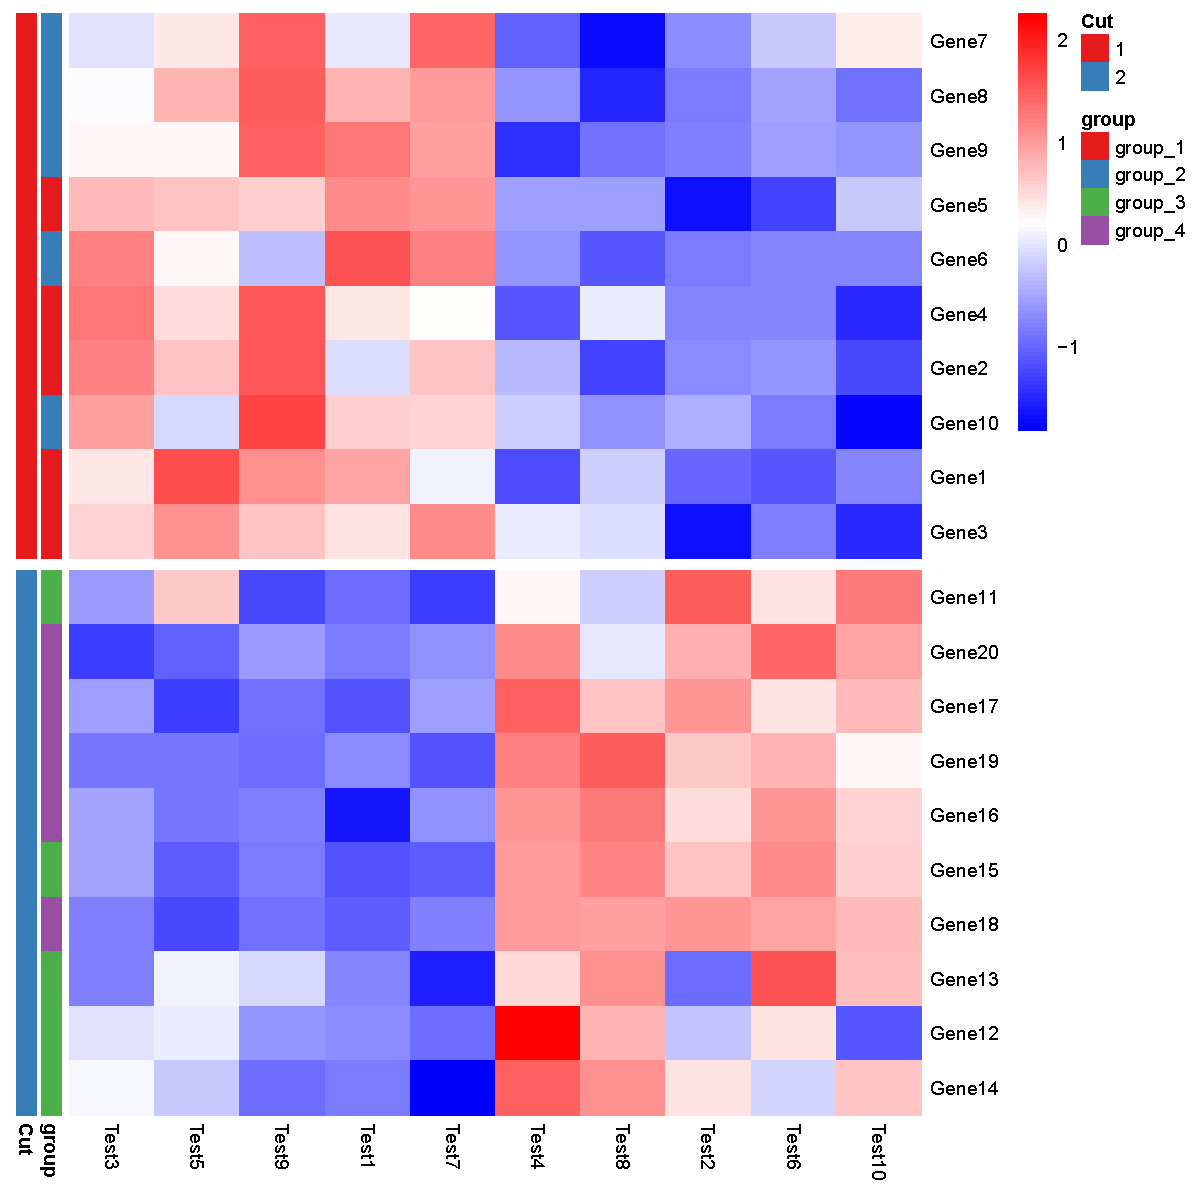
3.根据提取的信息复现之前的热图
为了验证所提取信息的正确与否,复现出一样的热图即可。为了方便复现,列的顺序我就直接使用参考资料中的方法实现。
3.1 将热图用一个变量存储
p <- pheatmap(edata,border_color=NA,color = colorRampPalette(c("blue", "white", "red"))(100),
              scale = "row",cutree_rows = 2,
              cluster_row = T,cluster_col = T,show_rownames=T,show_colnames=T,
              clustering_distance_rows = "euclidean",clustering_method='complete',
              annotation_row=annotation_row,annotation_colors=ann_colors)
p #运行查看是否和之前的热图一致
3.2 构建scale后的数据并排序
gn <- rownames(gene.cluster)
# gn <- rownames(edata)[p$tree_row[["order"]]]

sn <- colnames(edata)[p$tree_col[["order"]]]
test <- mat[gn,sn]
3.2 构建行注释信息
annotation_row <- data.frame(Cut = gene.cluster$v,
                             gene = rownames(gene.cluster))

annotation_row <- merge(annotation_row,pdata,by='gene')
rownames(annotation_row) <- annotation_row$gene
annotation_row <- annotation_row[rownames(test),c('group','Cut')]
annotation_row$Cut <- factor(annotation_row$Cut,levels = unique(gene.cluster$v))

ancols.Group <- c('#e41a1c','#377eb8','#4daf4a','#984ea3')
names(ancols.Group) <- unique(pdata$group)

ancols.Cut <- c('#e41a1c','#377eb8')
names(ancols.Cut) <- unique(gene.cluster$v)

ann_colors <- list(group = ancols.Group,
                   Cut = ancols.Cut)
3.2 画出复现后的热图
pheatmap(test,border_color=NA,color = colorRampPalette(c("blue", "white", "red"))(100),
         scale = "none",
         gaps_row = gaps,
         cluster_row = F,cluster_col = F,show_rownames=T,show_colnames=T,
         clustering_distance_rows = "euclidean",clustering_method='complete',
         annotation_row=annotation_row,annotation_colors=ann_colors,
         fontsize=7,width = 6, height = 6,
         filename = "heatmap.scale.row.rmTree.pdf")

全文中关键部分是第二部分,其实这也不是我写的,我只是读了 pheatmap 的源码,理解之后从里面直接复制过来的,所以说读源码可以解决相关的所有问题!!!
参考资料:
1.热图如何去掉聚类树的同时保留聚类的顺序?
