
gg.gap画截断图
主要记录使用 gg.gap 画截断图的过程及所碰到的一点问题。
参考资料中其实已经给出较为详细的说明,代码如下:
#install.packages("gg.gap")

library(gg.gap)
library(ggplot2)
library(patchwork)
#构建数据

data <-  data.frame(x = c("A", "B", "C", "D"),
             y = c(200, 20, 10, 15))
#画图

p1 = ggplot(data, aes(x = x, y = y, fill = x)) +
  geom_bar(stat = 'identity', position = position_dodge(),show.legend = FALSE) +
  theme_bw() + labs(x = NULL, y = NULL)
p2 <- gg.gap(plot = p1,
             segments = c(30, 190),
             tick_width = 10,
             rel_heights = c(3,0,1),
             ylim = c(0, 200)
)
p1+p2
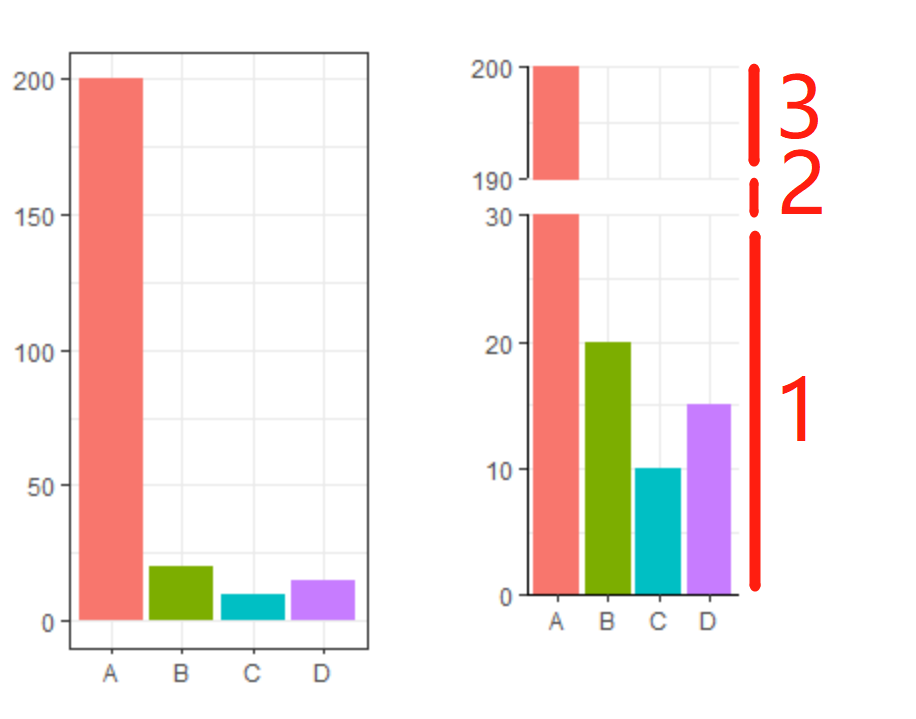
gg.gap 中主要参数说明如下:
segments: 需要截断的位置,示例中表示截断 y轴 在 30 到 90 的部分tick_width: 设置breakrel_heights: 截断后每个部分的比例,如上图所示从下往上依次分为三个部分,填写的是比例所以c(6,0,2)得到的结果与示例结果是一致的ylim: y 轴的范围
至此也就大致了解了 gg.gap 的用法,但是 ggplot2 中本人经常使用的是 theme_bw() ,把 theme 修改后的截断图有一点缺陷,有兴趣的可以自己尝试空看缺陷是啥。
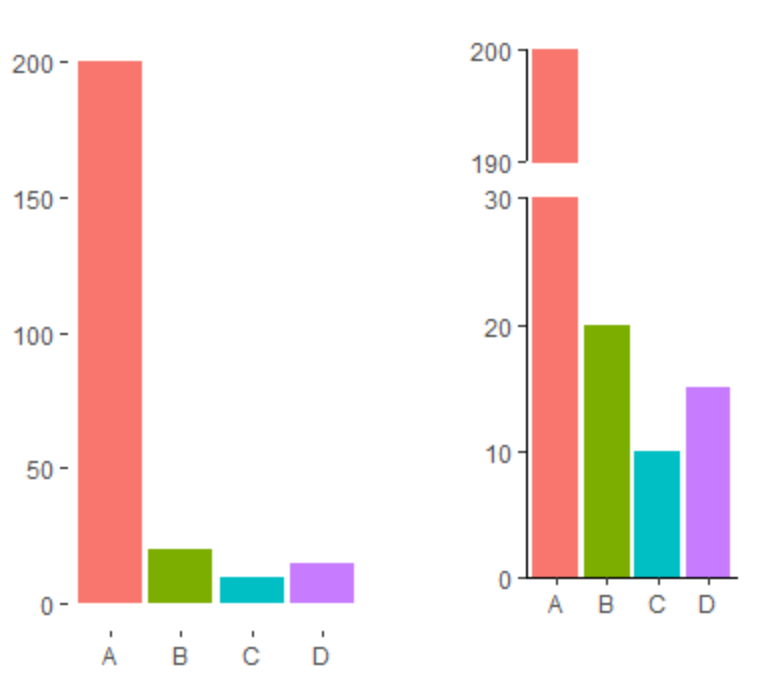
为了和以前作图风格基本保持一致,代码做出了下面的修改。就是把图片的背景颜色和网格去除掉,再做截断图。
p1 <- ggplot(data, aes(x = x, y = y, fill = x)) +
  geom_bar(stat = 'identity', position = position_dodge(),show.legend = FALSE) +
  theme(panel.background = element_rect(fill = "transparent",colour = NA),
        plot.background = element_rect(fill = "transparent",colour = NA)) +
  labs(x = NULL, y = NULL)

p2 <- gg.gap(plot = p1,
             segments = c(30, 190),
             tick_width = 10,
             rel_heights = c(3,0,1),
             ylim = c(0, 200)
)
p1+p2
参考资料:
1.ggplot2截断纵坐标–后续
2.gg.gap