
ComplexHeatmap中文版说明
本文主要是对 ComplexHeatmap Complete Reference(last revised on 2020-04-29)内容的翻译及理解,并且根据理解修改了部分示例以缩短原文的内容,主要是为了记录学习 ComplexHeatmap 包的过程,方便日后翻阅。
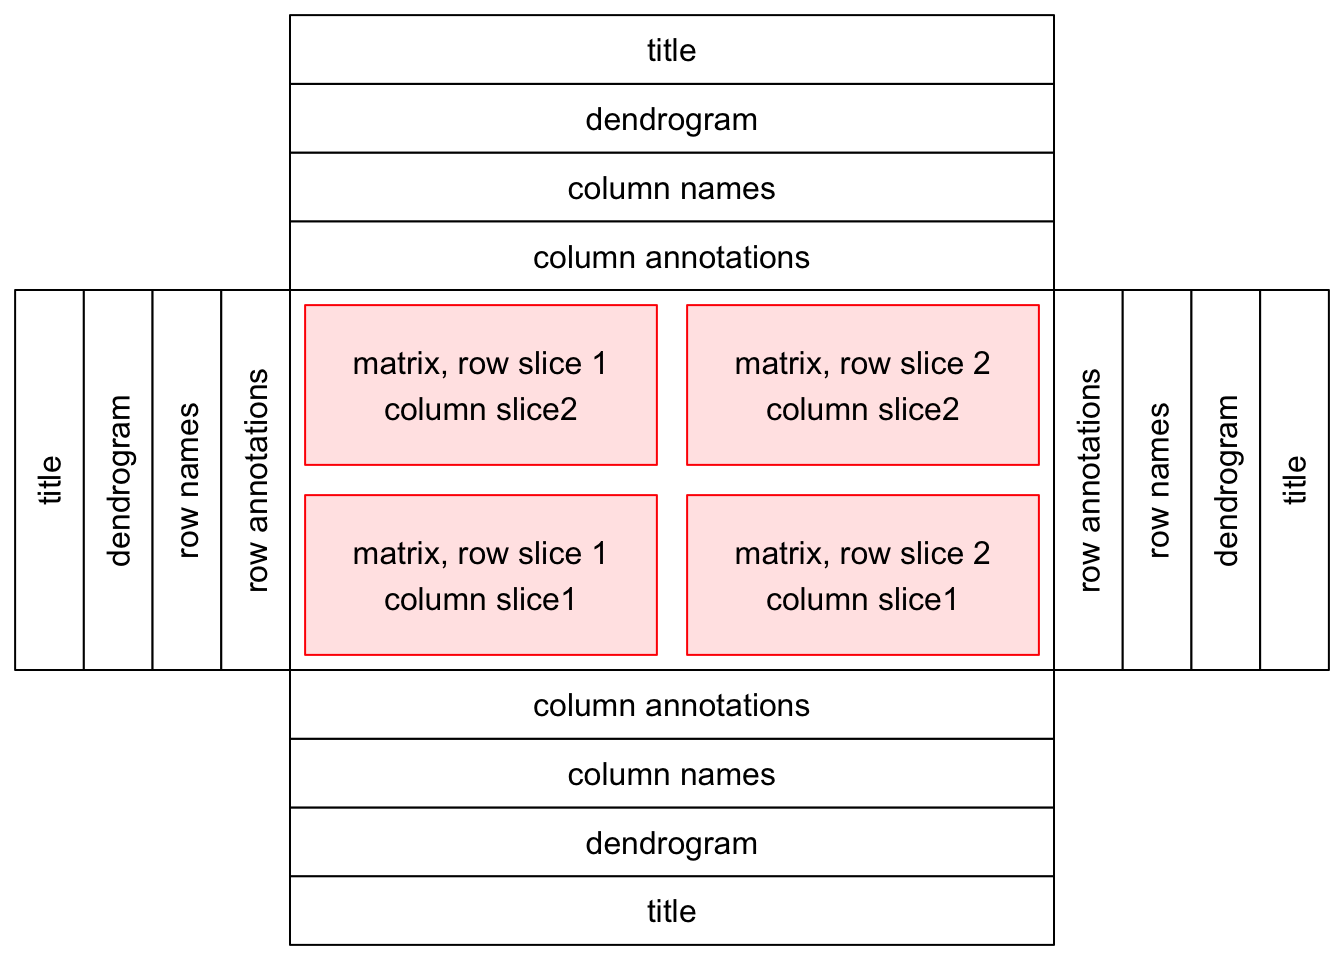
ComplexHeatmap 不仅可以画单个的热图,也可以制作多个热图及注释信息相互组合起来的更为复杂的图形,所以有必要先了解作者的构图思路。
下图是作者的构图布局图,中间红色部分是画热图的部分,单个或者多个热图都可以,四个边都有可以添加如下图四种信息的部分。
按照原文章节安排,本文主要分为下面八个板块,其中略有删减,如若不懂可以翻看原文。
ComplexHeatmap 安装代码如下,随便选择一种即可:
install.packages("ComplexHeatmap")
devtools::install_github("jokergoo/ComplexHeatmap")
1 A Single Heatmap
本节主要介绍如何绘制单个热图,这也是绘制热图中需求最大的一部分,理解这部分就可以实现其他画热图R包(如 pheatmap 包)的绝大部分功能。
# 加载R包

rm(list = ls())
library(ComplexHeatmap)

# 准备数据

set.seed(123)
nr1 = 4; nr2 = 8; nr3 = 6; nr = nr1 + nr2 + nr3
nc1 = 6; nc2 = 8; nc3 = 10; nc = nc1 + nc2 + nc3
mat = cbind(rbind(matrix(rnorm(nr1*nc1, mean = 1,   sd = 0.5), nr = nr1),
                  matrix(rnorm(nr2*nc1, mean = 0,   sd = 0.5), nr = nr2),
                  matrix(rnorm(nr3*nc1, mean = 0,   sd = 0.5), nr = nr3)),
            rbind(matrix(rnorm(nr1*nc2, mean = 0,   sd = 0.5), nr = nr1),
                  matrix(rnorm(nr2*nc2, mean = 1,   sd = 0.5), nr = nr2),
                  matrix(rnorm(nr3*nc2, mean = 0,   sd = 0.5), nr = nr3)),
            rbind(matrix(rnorm(nr1*nc3, mean = 0.5, sd = 0.5), nr = nr1),
                  matrix(rnorm(nr2*nc3, mean = 0.5, sd = 0.5), nr = nr2),
                  matrix(rnorm(nr3*nc3, mean = 1,   sd = 0.5), nr = nr3))
            )
mat = mat[sample(nr, nr), sample(nc, nc)] # 随机打乱行和列

rownames(mat) = paste0("row", seq_len(nr))
colnames(mat) = paste0("column", seq_len(nc))
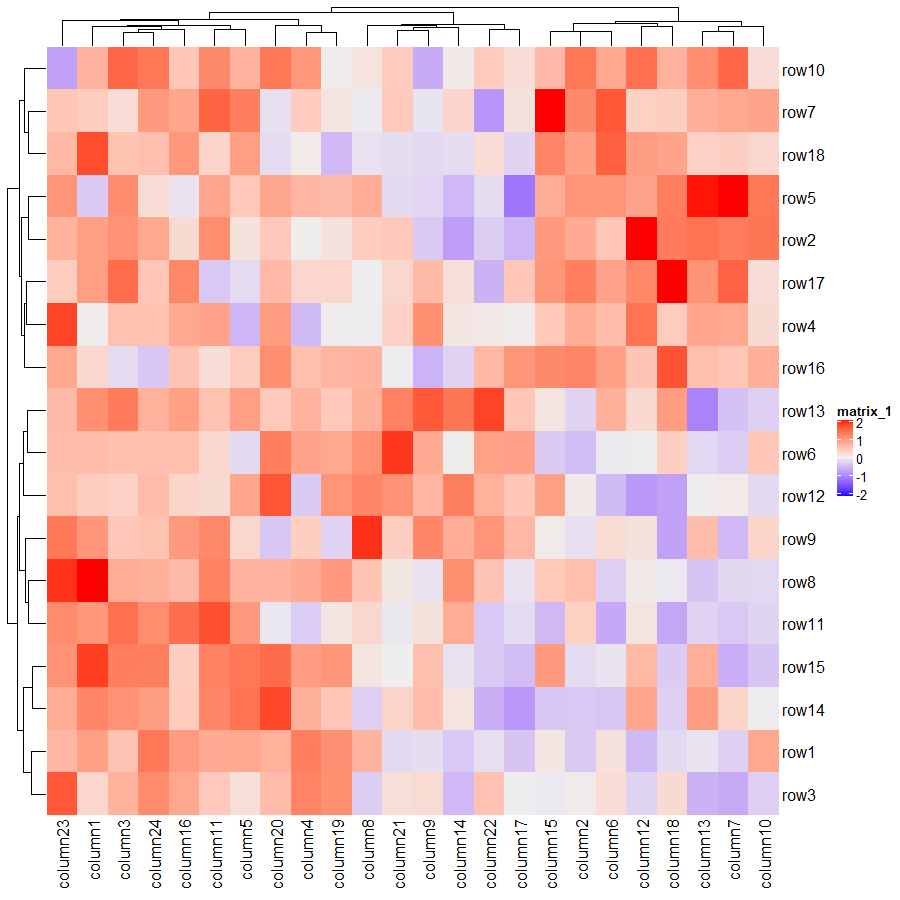
使用默认参数的代码及绘图结果如下:
Heatmap(mat)
这里插播一个批量出图的小技巧,可以在循环里面使用如下代码:
ht = Heatmap(mat)
draw(ht)
1.1 Colors
图的好看与否,配色占了相当一部分的比重。
col_fun = circlize::colorRamp2(c(-2, 0, 2), c("green", "white", "red"))
Heatmap(mat, name = "mat", col = col_fun)
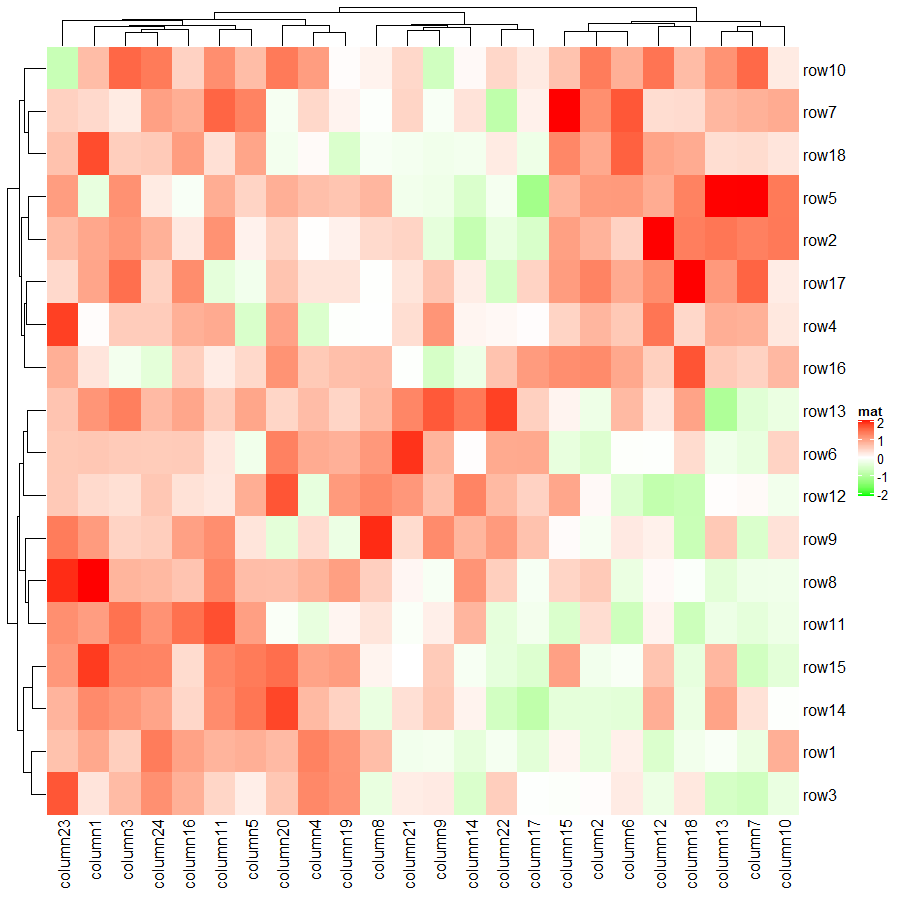
上面代码利用 col 参数将默认的蓝白红变成了绿白红,其中颜色映射的数值范围是正负 2 之间,超过此范围的值的颜色都将使用阈值所对应的颜色。下面代码将会验证这个说法,善于利用这种设置阈值颜色的手段,可以提高热图的对比度。
mat2 = mat
mat2[1, 1] = 100000 # 设置极端值

Heatmap(mat2, name = "mat", col = col_fun)
Heatmap(mat2, name = "mat", col = circlize::colorRamp2(c(-20, 0, 20), c("green", "white", "red")))
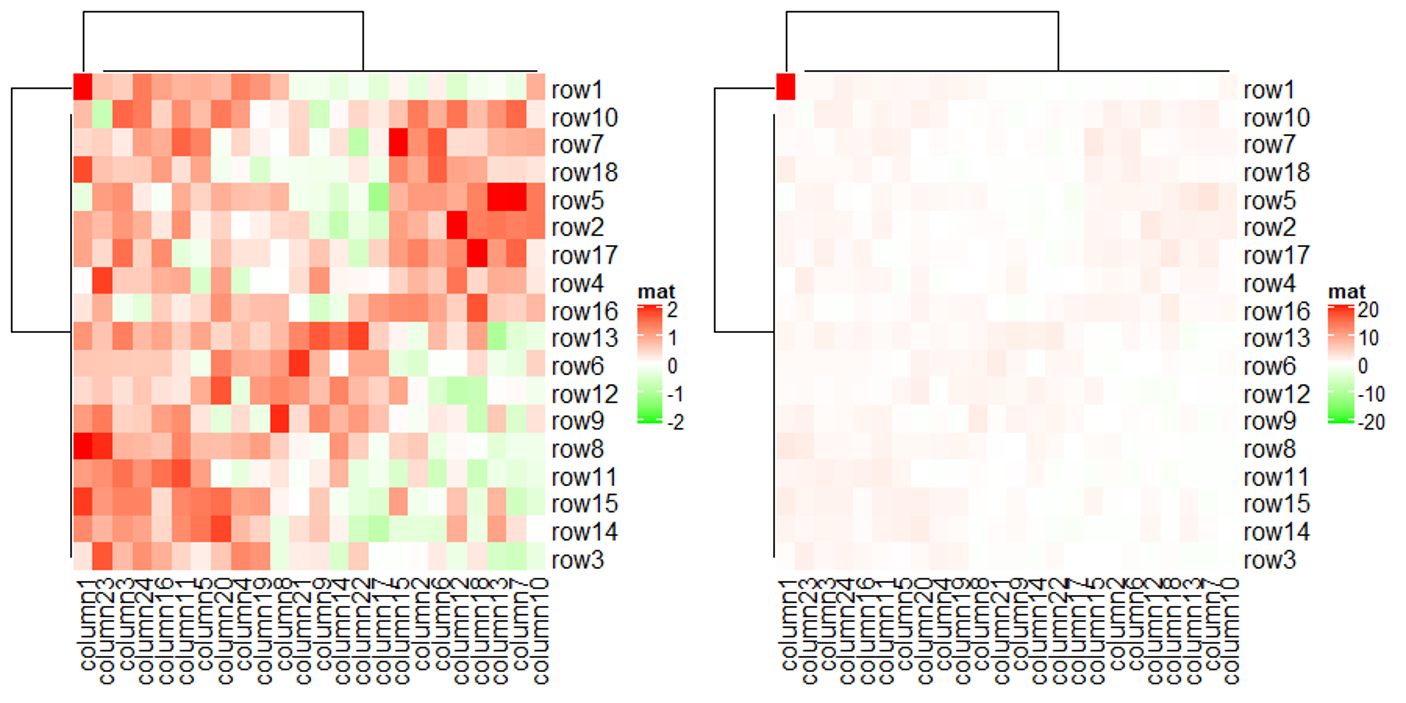
上图仅消除了极端值对颜色的影响,并没有消除极端值对聚类的影响,这个问题在聚类的小节会有相关说明。
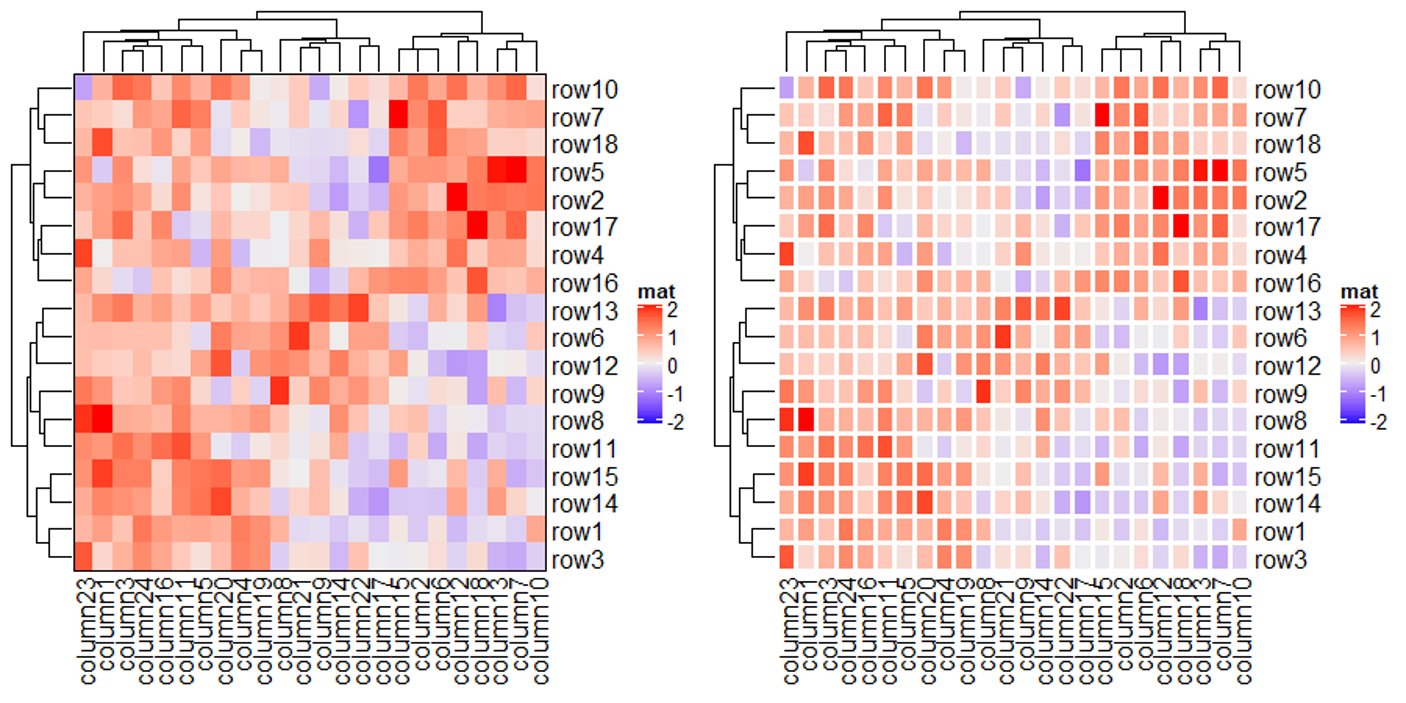
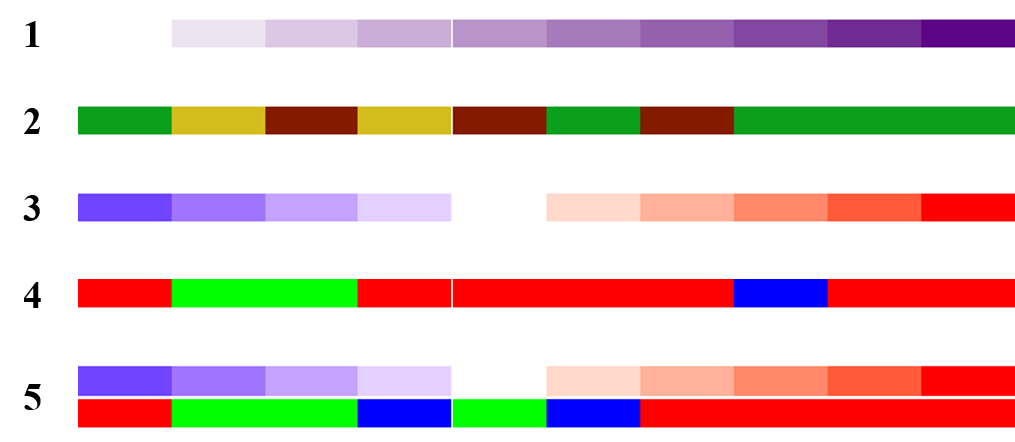
除了上述利用 circlize::colorRamp2 来设置阈值所映射的颜色之外,也可以直接填入颜色向量集来改变颜色。
Heatmap(mat, name = "mat", col = rev(rainbow(10)))
Heatmap(mat, name = "mat", col = c('#7b3294','#c2a5cf','#f7f7f7','#a6dba0','#008837'))
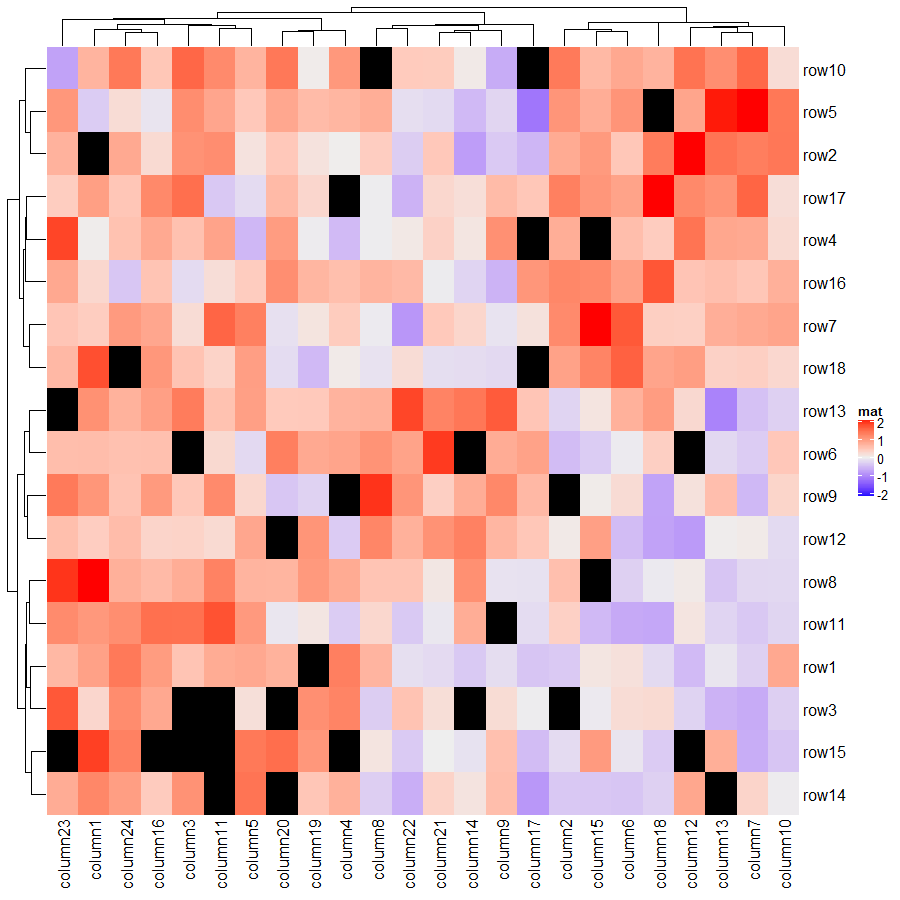
值得一提的是 ComplexHeatmap 支持矩阵中包含 NA 值,并且可以使用 na_col 来控制其颜色,下面代码将 NA 值的颜色设置为黑色。
mat_with_na = mat
na_index = sample(c(TRUE, FALSE), nrow(mat)*ncol(mat), replace = TRUE, prob = c(1, 9))
mat_with_na[na_index] = NA
Heatmap(mat_with_na, name = "mat", na_col = "black")
热图主体的边框及热图中每个格子的边框都是可以进行调整的。
# 热图主体的边框

Heatmap(mat, name = "mat", border = TRUE)

# 热图每个格子的边框 border

Heatmap(mat, name = "mat", rect_gp = gpar(col = "white", lwd = 3))
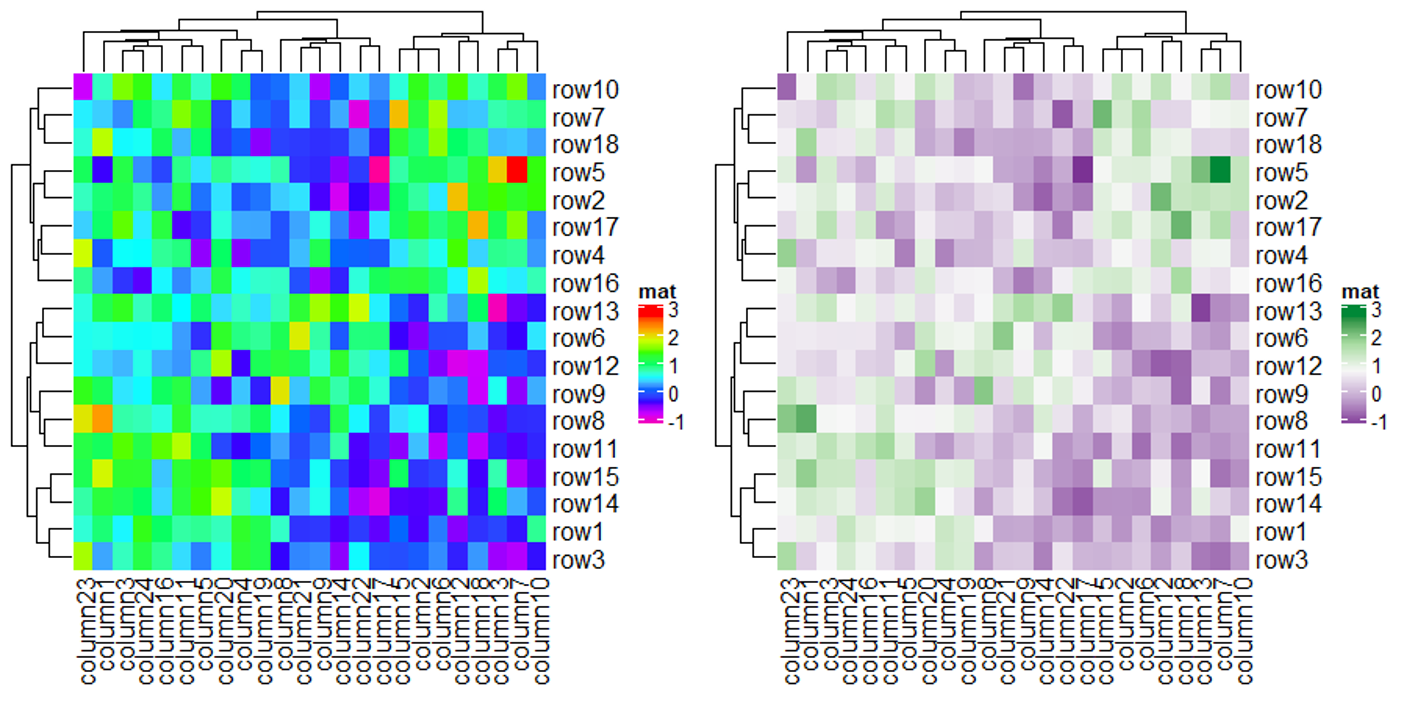
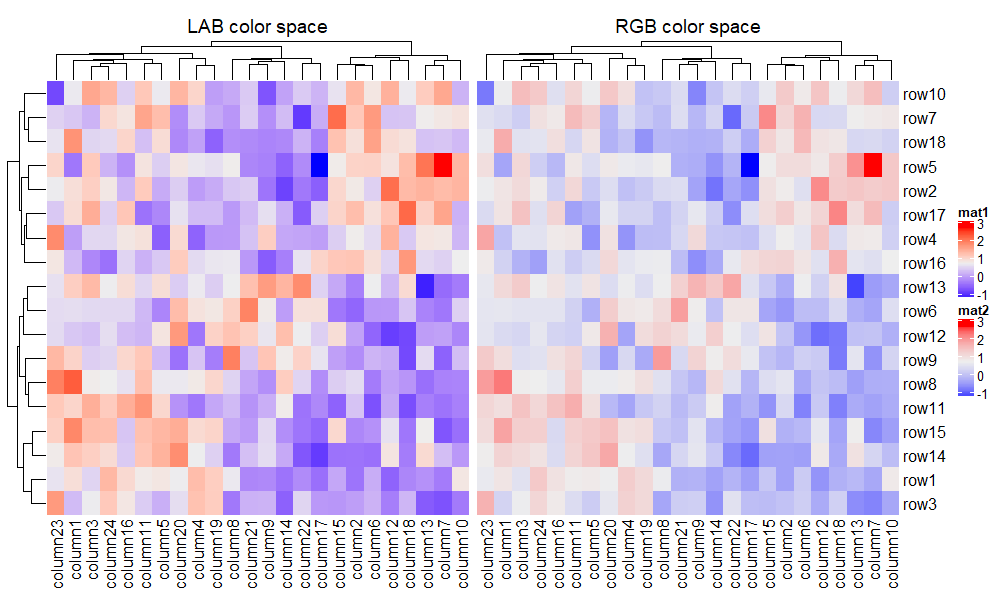
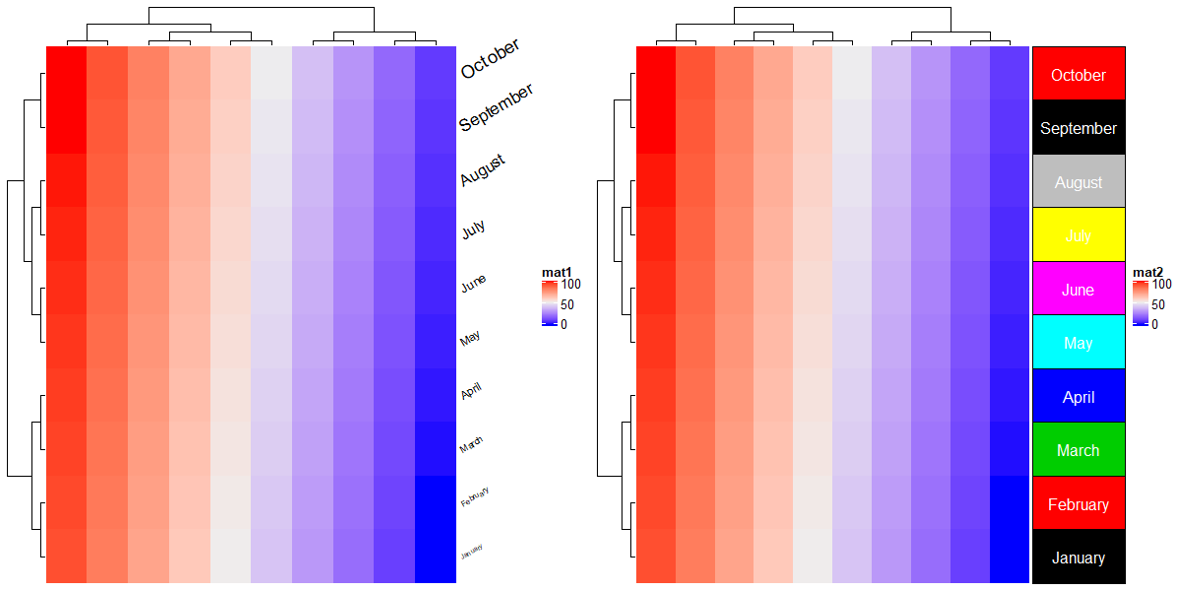
最后比较一下不同色系之间的差异,有需求的用户可以在下面代码的基础上自己探索适合自己的色系,提供的色系有 RGB, HSV, HLS, LAB, XYZ, sRGB 和 LUV。
f1 = circlize::colorRamp2(seq(min(mat), max(mat), length = 3), c("blue", "#EEEEEE", "red"))
f2 = circlize::colorRamp2(seq(min(mat), max(mat), length = 3), c("blue", "#EEEEEE", "red"),
                space = "RGB")
Heatmap(mat, name = "mat1", col = f1, column_title = "LAB color space") + # 默认

Heatmap(mat, name = "mat2", col = f2, column_title = "RGB color space")
1.2 Titles
与标题相关的参数都是带有 title 的,主要有行标题和列标题,比较实用参数代码展示如下:
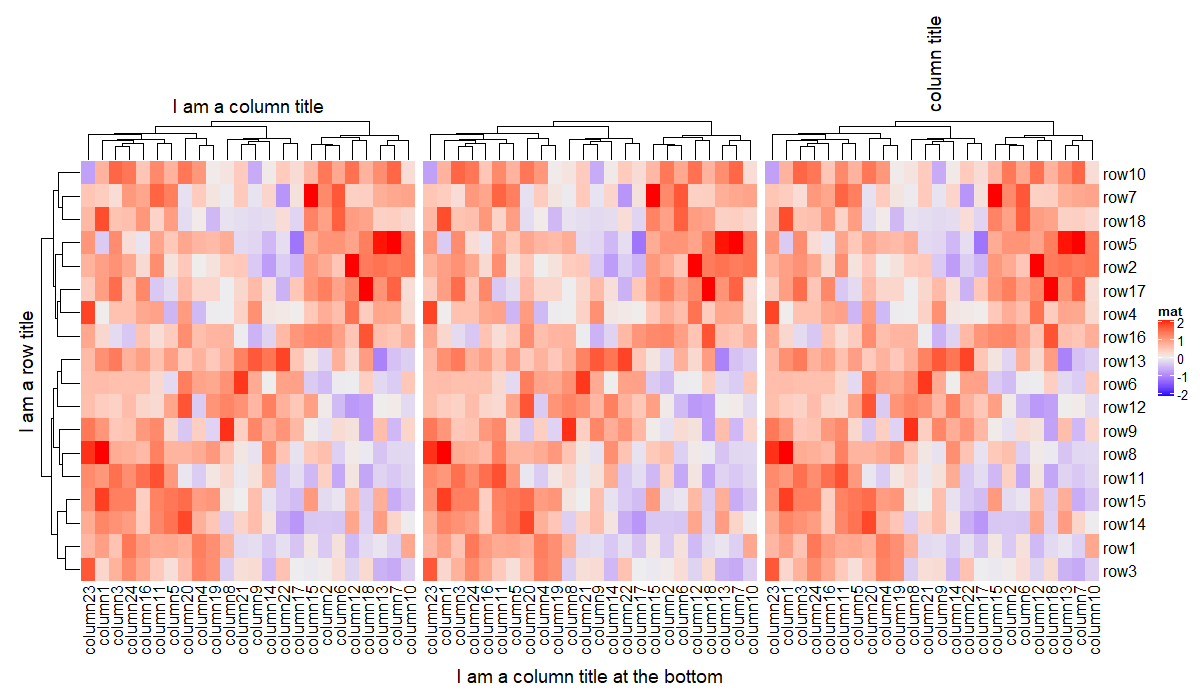
Heatmap(mat, name = "mat",
        column_title = "I am a column title", # 列标题

        row_title = "I am a row title") + # 行标题

Heatmap(mat, name = "mat", column_title = "I am a column title at the bottom",
        column_title_side = "bottom") + # 标题位置("left", "right","top", "bottom")

Heatmap(mat, name = "mat", column_title = "column title", column_title_rot = 90) # 旋转角度(0, 90, 270)
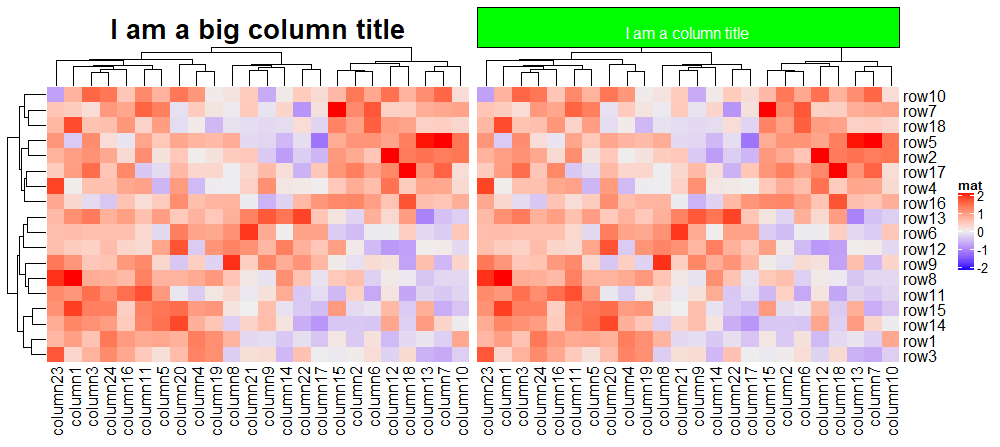
Heatmap(mat, name = "mat", column_title = "I am a big column title",
        column_title_gp = gpar(fontsize = 20, # 标题大小

                               fontface = "bold")) + # 标题字体

Heatmap(mat, name = "mat", column_title = "I am a column title",
        column_title_gp = gpar(fill = "green", # 标题背景色

                               col = "white", # 标题颜色

                               border = "black")) # 标题边框色
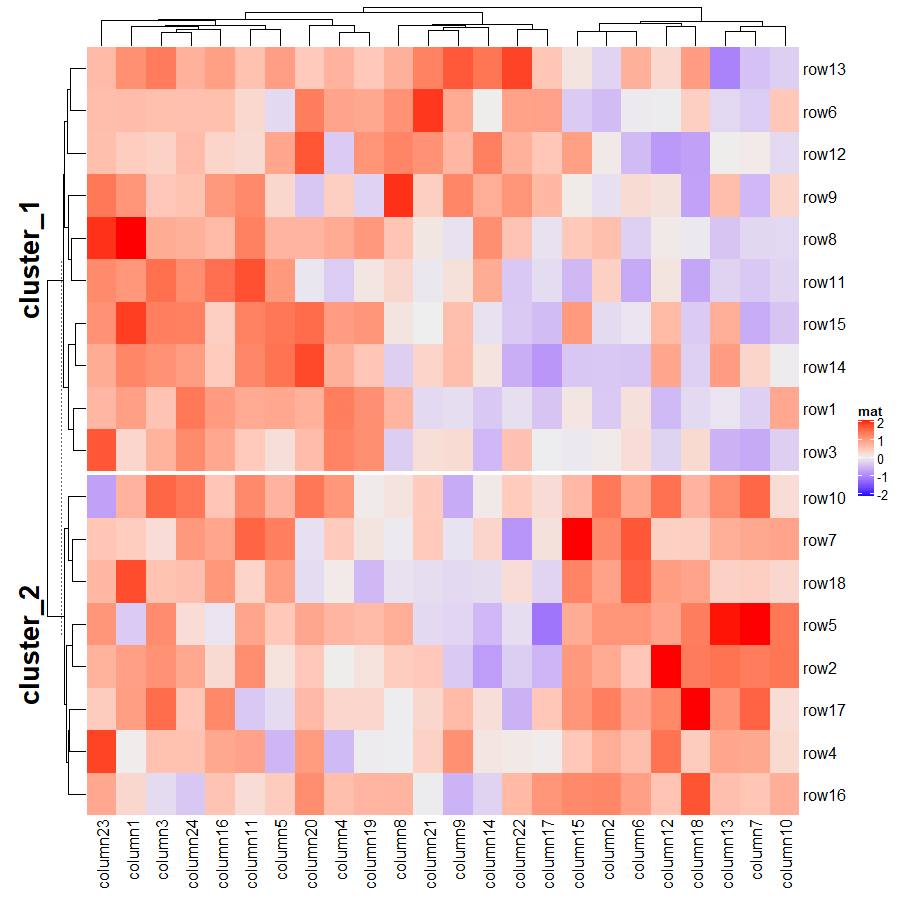
还可以设置分割后的热图的各组标题。
Heatmap(mat, name = "mat", row_km = 2, row_title = "cluster_%s",
        row_title_gp = gpar(fontsize = 20,fontface = "bold"))
1.3 Clustering
Clustering 分为两步首先需要计算距离,再进行聚类。这两步在 ComplexHeatmap 中提供有内置的方法,用户也可以传入自定义方法。
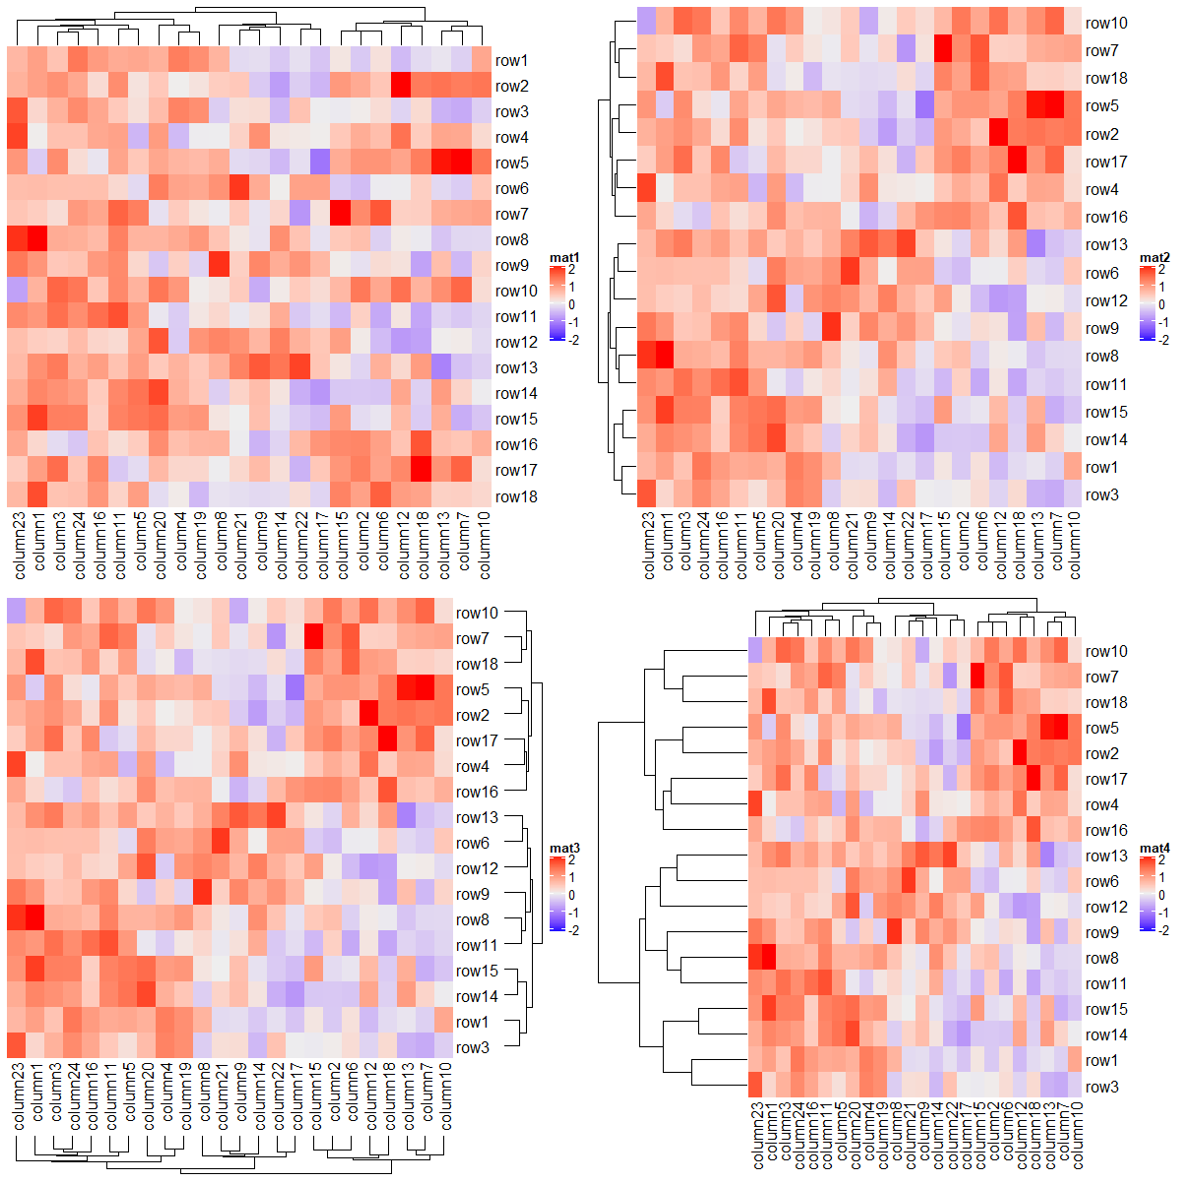
下面代码主要是一些图形控制方面的参数:
Heatmap(mat, name = "mat1", cluster_rows = FALSE) # 关闭行聚类

Heatmap(mat, name = "mat2", show_column_dend = FALSE) # 隐藏列树图

Heatmap(mat, name = "mat3",
        row_dend_side = "right", # 行树图位置

        column_dend_side = "bottom") # 列树图位置

Heatmap(mat, name = "mat4",
        column_dend_height = unit(1, "cm"), # 列树图高度

        row_dend_width = unit(4, "cm")) # 行树图宽度
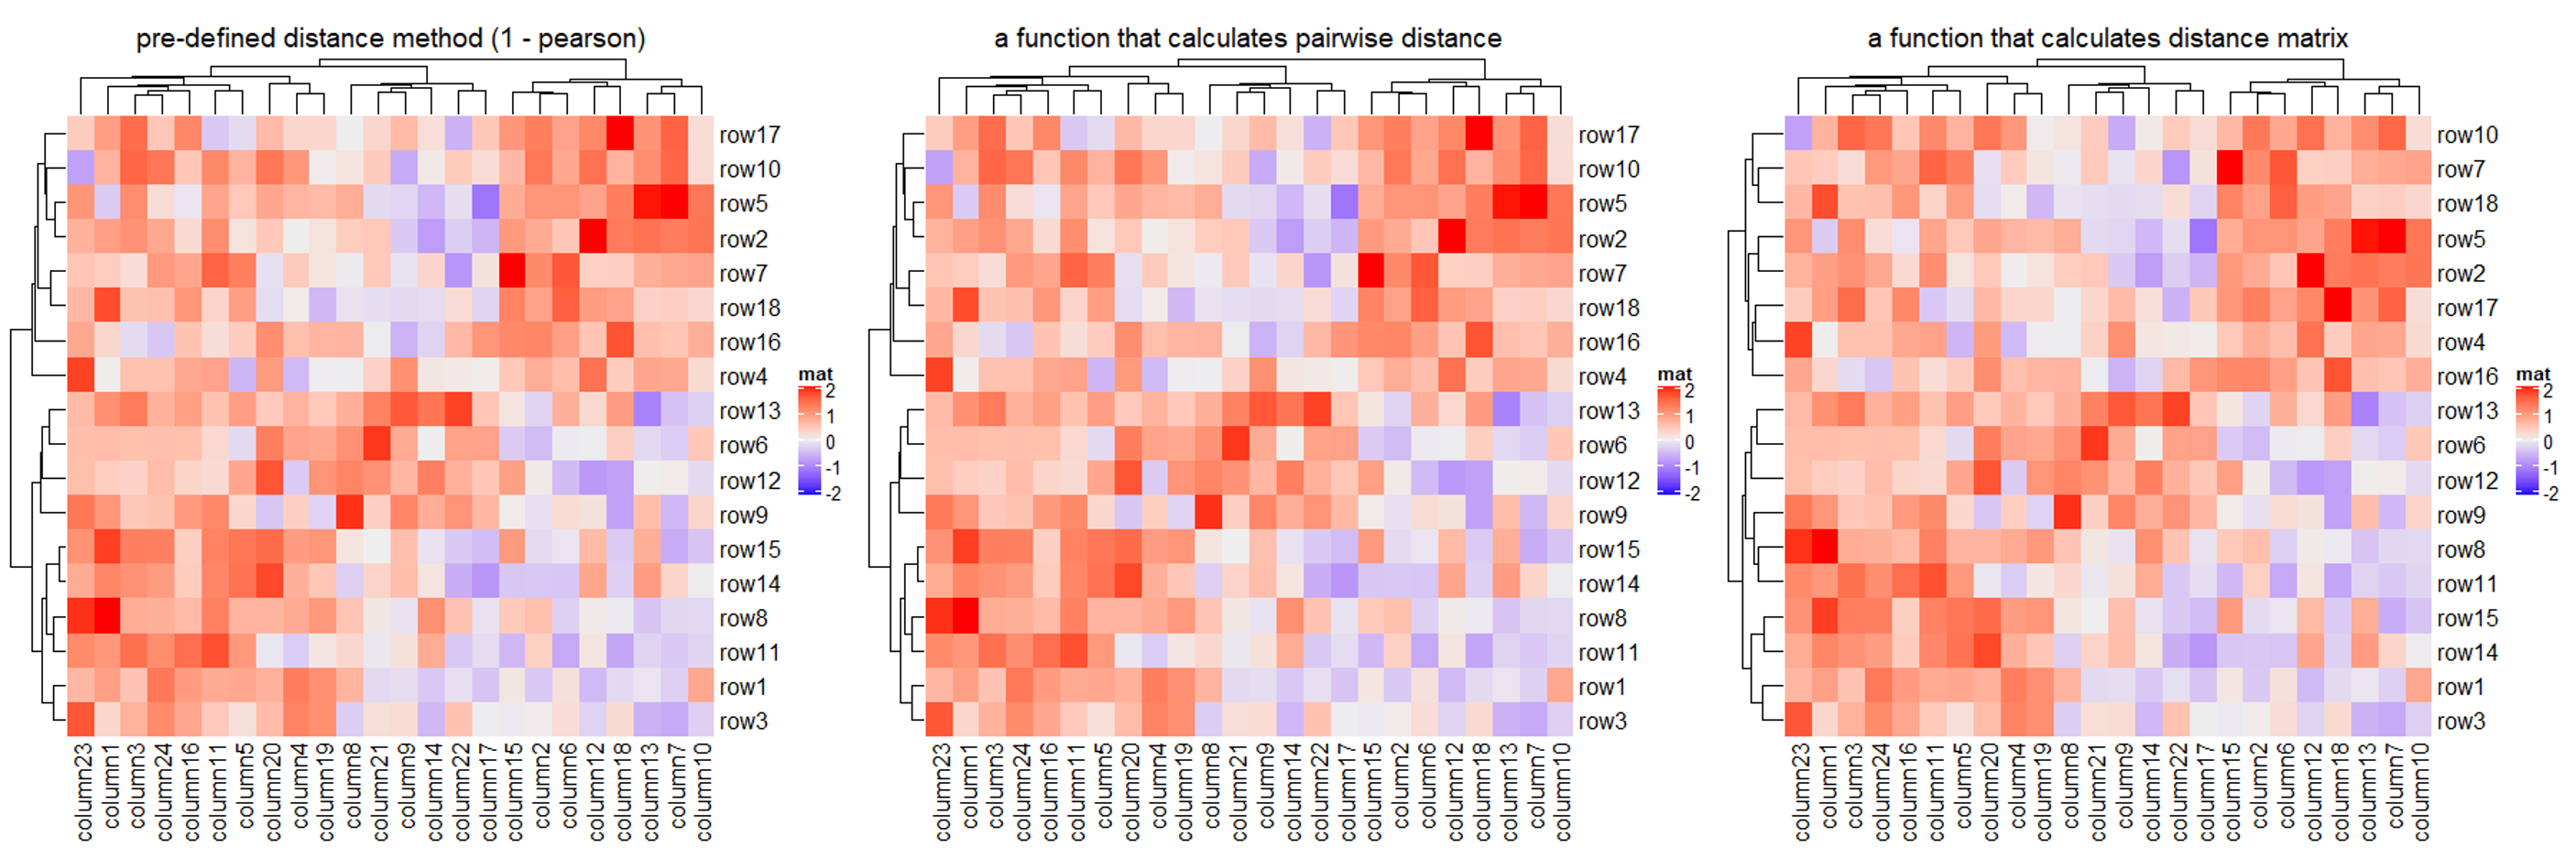
1.3.1 Distance methods
使用 clustering_distance_rows/clustering_distance_column 来选择不同的距离计算方法或者传入自定义的方法,内置的计算距离方法有 euclidean, maximum, manhattan, canberra, binary, minkowski, pearson, spearman 和 kendall,并且是允许出现** NA 值**的。
Heatmap(mat, name = "mat", clustering_distance_rows = "pearson",
        column_title = "pre-defined distance method (1 - pearson)")

# 可以自定义计算矩阵的距离,函数应该只包含一个参数

Heatmap(mat, name = "mat", clustering_distance_rows = function(m) dist(m),
        column_title = "a function that calculates distance matrix")

# 可以自定义计算向量的距离,函数应该包含两个参数(速度会减慢)

Heatmap(mat, name = "mat", clustering_distance_rows = function(x, y) 1 - cor(x, y),
        column_title = "a function that calculates pairwise distance")
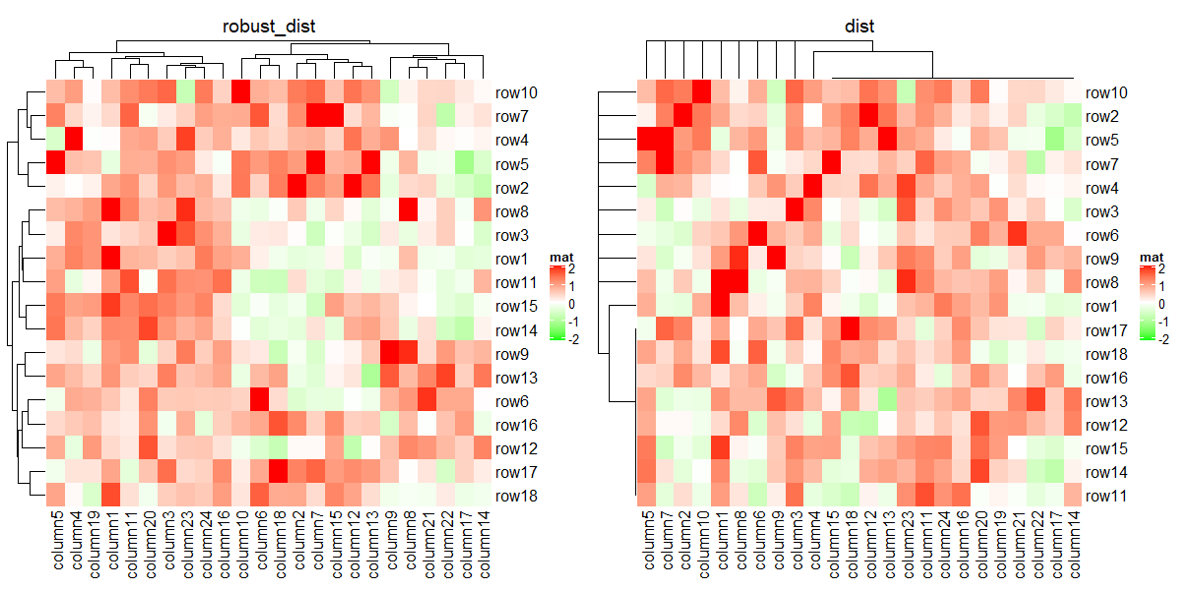
下面就来展示一下自定义的一些骚操作。前面看到了极端值对聚类的影响,我们可以在计算距离的时候去除这个影响。
# 构建含有极端值的矩阵

mat_with_outliers = mat
for(i in  1:10) mat_with_outliers[i, i] = 1000

# 自定义的距离计算方法

robust_dist = function(x, y) {
  qx = quantile(x, c(0.1, 0.9))
  qy = quantile(y, c(0.1, 0.9))
  l = x > qx[1] & x < qx[2] & y > qy[1] & y < qy[2]
  x = x[l]
  y = y[l]
  sqrt(sum((x - y)^2))
}

# 利用 clustering_distance_* 传入自定义的距离计算方法

Heatmap(mat_with_outliers, name = "mat",
        col = circlize::colorRamp2(c(-2, 0, 2), c("green", "white", "red")),
        clustering_distance_rows = robust_dist,
        clustering_distance_columns = robust_dist,
        column_title = "robust_dist")

# 使用默认方法

Heatmap(mat_with_outliers, name = "mat",
        col = circlize::colorRamp2(c(-2, 0, 2), c("green", "white", "red")),
        column_title = "dist")
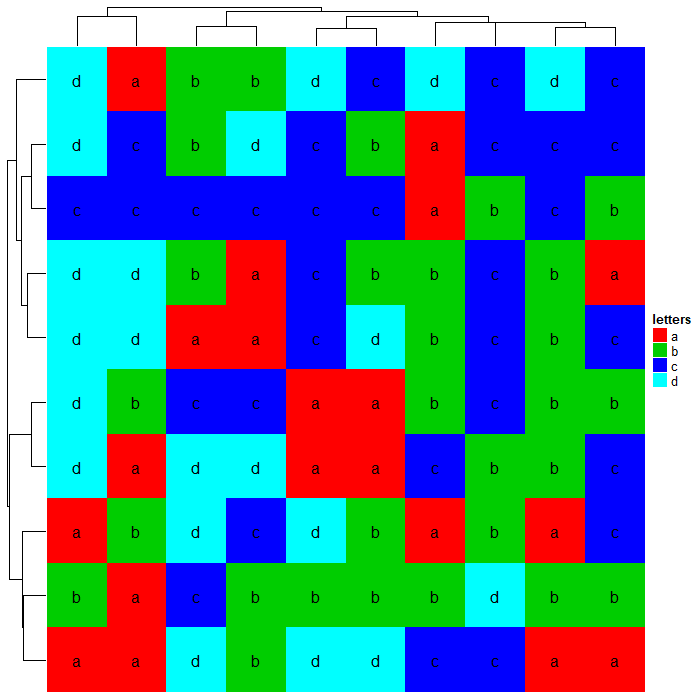
提供合适的方法,字符串同样也可以聚类。
mat_letters = matrix(sample(letters[1:4], 100, replace = TRUE), 10)

# distance in the ASCII table

dist_letters = function(x, y) {
  x = strtoi(charToRaw(paste(x, collapse = "")), base = 16)
  y = strtoi(charToRaw(paste(y, collapse = "")), base = 16)
  sqrt(sum((x - y)^2))
}

Heatmap(mat_letters, name = "letters", col = structure(2:5, names = letters[1:4]),
        clustering_distance_rows = dist_letters, clustering_distance_columns = dist_letters,
        cell_fun = function(j, i, x, y, w, h, col) { # add text to each grid

          grid.text(mat_letters[i, j], x, y)
        })
1.3.2 Clustering methods
使用 clustering_method_rows/clustering_method_column 来选择不同的聚类方法或者传入自定义的方法,内置的计算距离方法有 ward.D, ward.D2, single, complete 等。
Heatmap(mat, name = "mat", clustering_method_rows = "single")
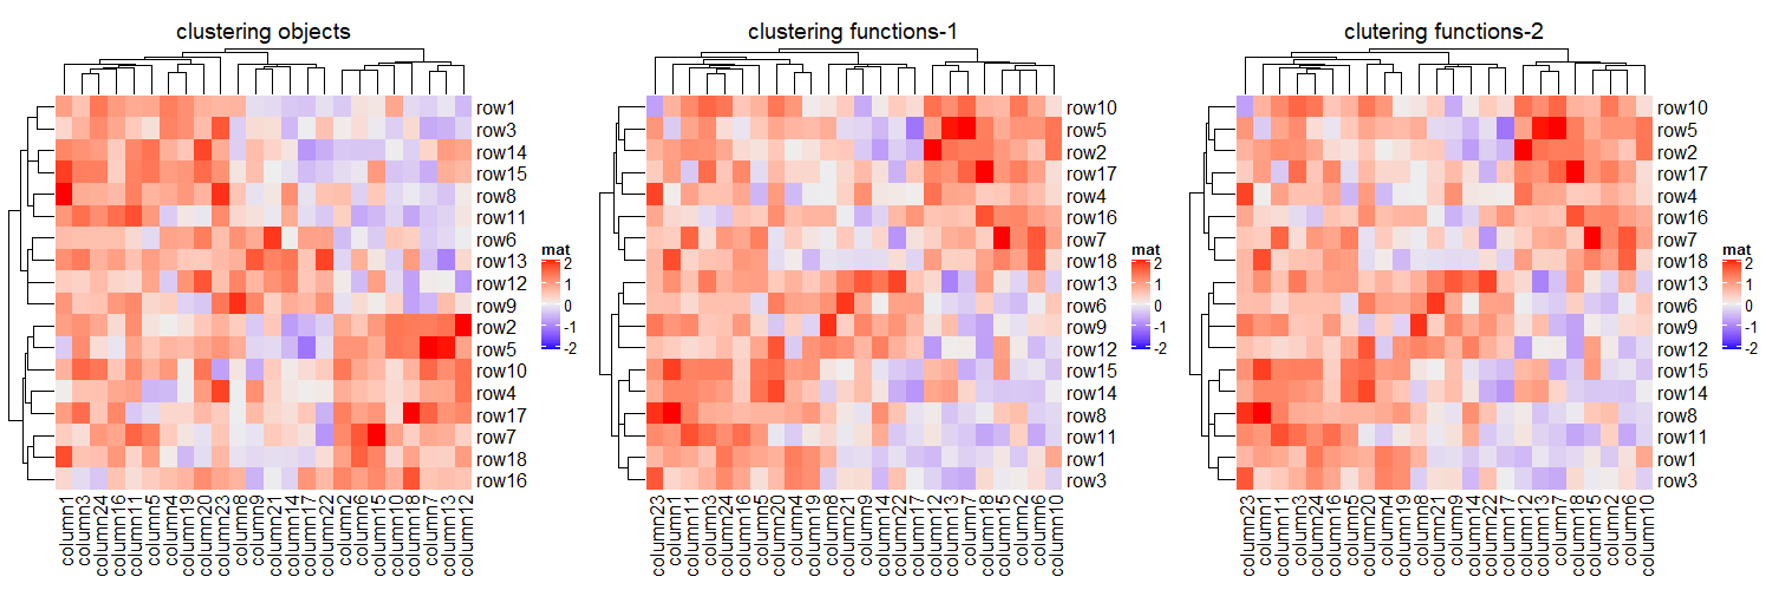
下面展示了三种自定义方法传入的方式,效果是一样的:
library(cluster)
Heatmap(mat, name = "mat",
        cluster_rows = diana(mat),
        cluster_columns = agnes(t(mat)),
        column_title = "clustering objects")

# if cluster_columns is set as a function, you don't need to transpose the matrix

Heatmap(mat, name = "mat",
        cluster_rows = diana,
        cluster_columns = agnes,
        column_title = "clustering functions")

Heatmap(mat, name = "mat",
        cluster_rows = function(m) as.dendrogram(diana(m)),
        cluster_columns = function(m) as.dendrogram(agnes(m)),
        column_title = "clutering functions")
在行列比较多的情况下,速度又成为了一个需求。我们就可以使用 fastcluster 来加速聚类,如下展示两种方式,其效果是一样的,自己运行一下看看就行了:
# 使用 fastcluster 加快聚类速度

fh = function(x) fastcluster::hclust(dist(x))
Heatmap(mat, name = "mat", cluster_rows = fh, cluster_columns = fh)

# 将fastcluster作为默认聚类方法

ht_opt$fast_hclust = TRUE # used in all heatmaps


group = kmeans(t(mat), centers = 3)$cluster
Heatmap(mat, name = "mat", cluster_columns = cluster_within_group(mat, group))

ht_opt(RESET = TRUE) # 重置为默认配置
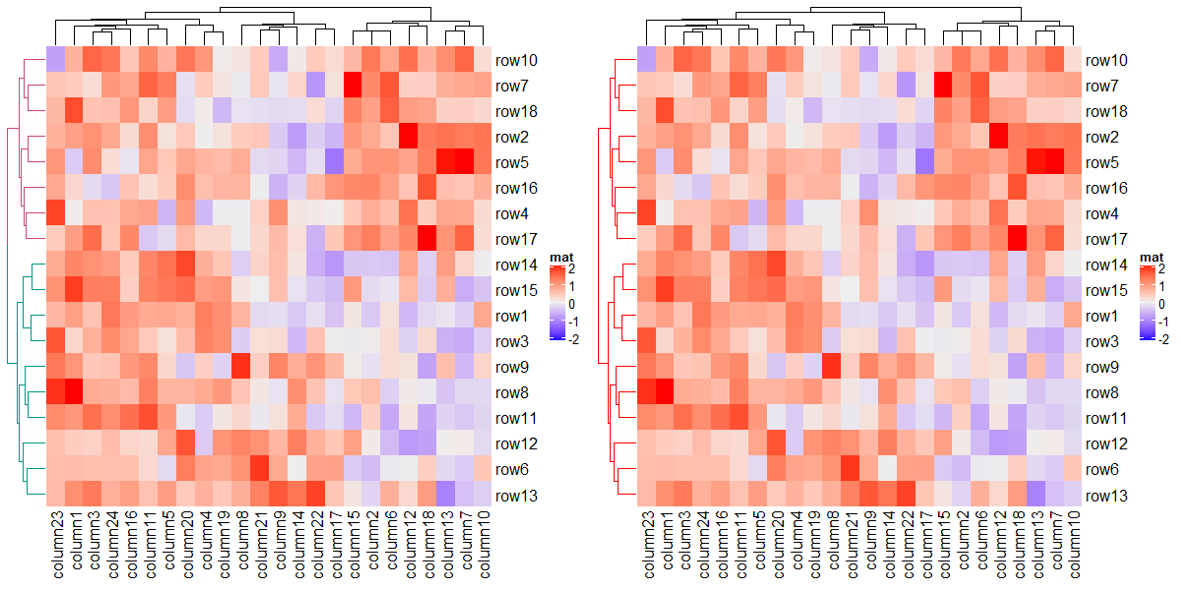
1.3.3 Render dendrograms
树图同样也可以使用默认和传入已经构好的,展示如下:
library(dendextend)
row_dend = as.dendrogram(hclust(dist(mat)))
row_dend = color_branches(row_dend, k = 2) # `color_branches()` returns a dendrogram object

Heatmap(mat, name = "mat", cluster_rows = row_dend)

Heatmap(mat, name = "mat", cluster_rows = row_dend, row_dend_gp = gpar(col = "red")) # 树图颜色
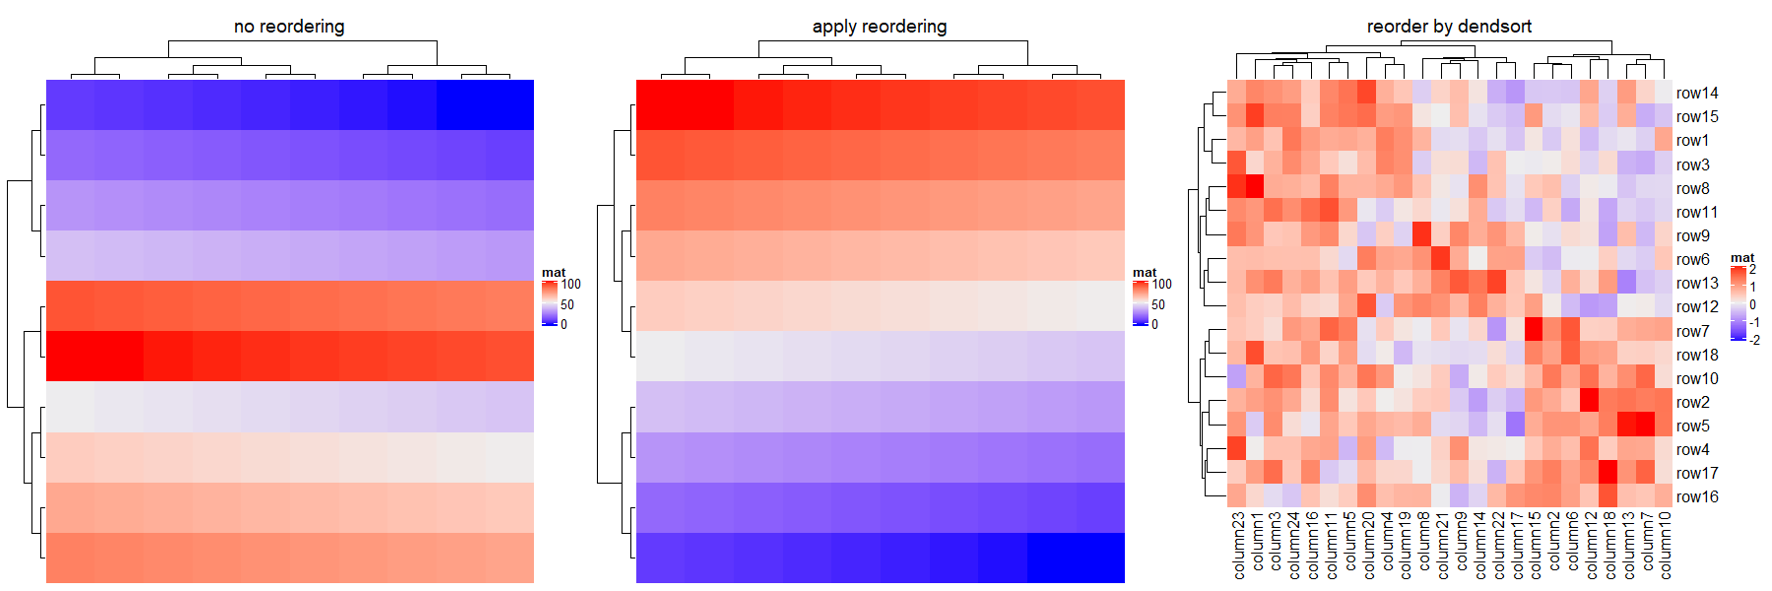
1.3.4 Reorder dendrograms
可以使用 row_dend_reorder 参数来对聚类后的结果进行排序,也可以使用 cluster_rows 在外面排序好之后再传入。
m2 = matrix(1:100, nr = 10, byrow = TRUE)
Heatmap(m2, name = "mat", row_dend_reorder = FALSE, column_title = "no reordering")
Heatmap(m2, name = "mat", row_dend_reorder = TRUE, column_title = "apply reordering")
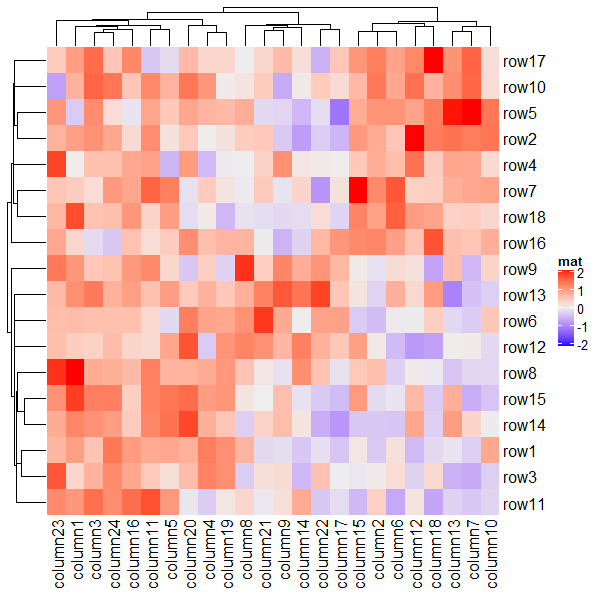
# 使用 dendsort 再排序后传入
Heatmap(mat, name = "mat", column_title = "default reordering")
library(dendsort)
dend = dendsort(hclust(dist(mat)))
Heatmap(mat, name = "mat", cluster_rows = dend, column_title = "reorder by dendsort")
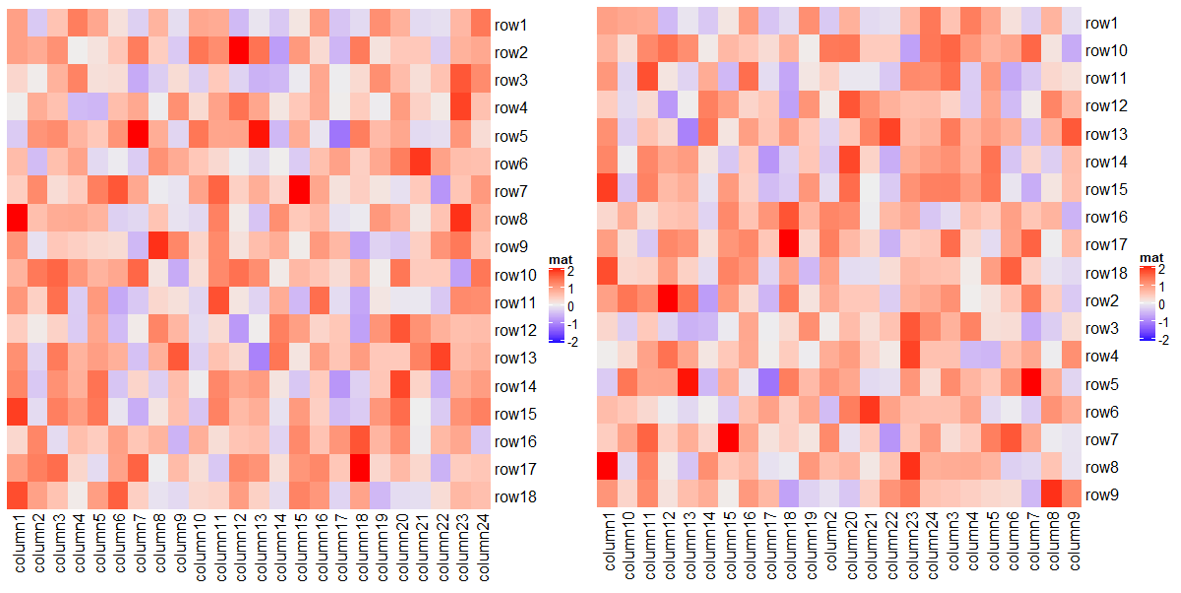
1.4 Set row and column orders
当然聚类并不是必须的,也可以不聚类,使用自定义的顺序,只需在 row_order/column_order 中传入一个所需顺序的行列名的向量即可。
Heatmap(mat, name = "mat",
        row_order = order(as.numeric(gsub("row", "", rownames(mat)))),
        column_order = order(as.numeric(gsub("column", "", colnames(mat)))))

Heatmap(mat, name = "mat",
        row_order = sort(rownames(mat)),
        column_order = sort(colnames(mat)))
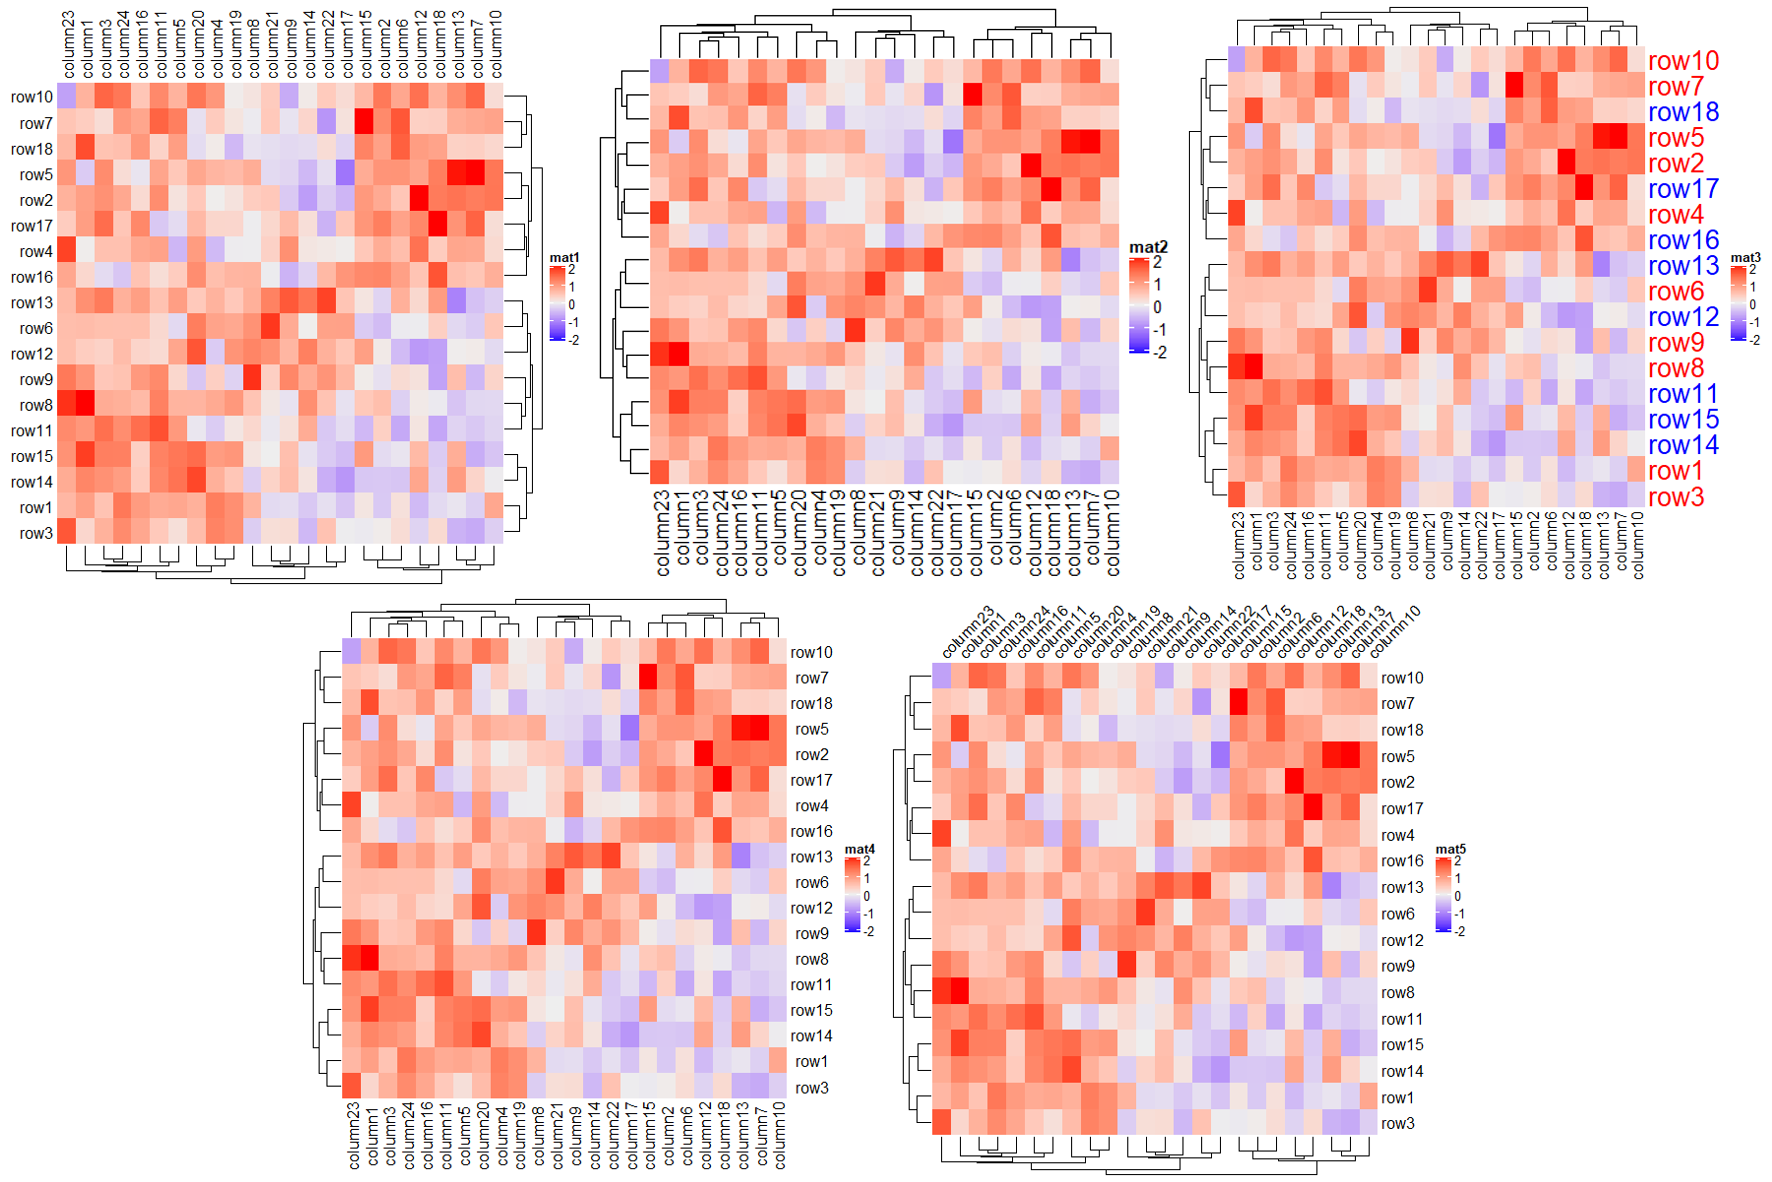
1.5 Dimension names
下面是名称相关设置的一些参数的说明。
Heatmap(mat, name = "mat1",
        row_names_side = "left", column_names_side = "top", # 行/列名位置

        row_dend_side = "right", column_dend_side = "bottom") # 行/列树图位置


Heatmap(mat, name = "mat2", show_row_names = FALSE) # 不显示行名

Heatmap(mat, name = "mat3", row_names_gp = gpar(fontsize = 20, # 行名大小

                                               col = c(rep("red", 10), rep("blue", 8)))) # 行名颜色


Heatmap(mat, name = "mat4",
        row_names_centered = TRUE, # 行名居中

        column_names_centered = TRUE) # 列名居中


Heatmap(mat, name = "mat5",
        column_names_rot = 45, #列名旋转角度

        column_names_side = "top", #列名位置

        column_dend_side = "bottom") #列树图位置
如果名称太长可以使用 row_names_max_width 来显示过长的名字。
mat2 = mat
rownames(mat2)[1] = paste(c(letters, LETTERS), collapse = "")
Heatmap(mat2, name = "mat")
Heatmap(mat2, name = "mat",
        row_names_max_width = max_text_width(
          rownames(mat2),
          gp = gpar(fontsize = 12)
        ))
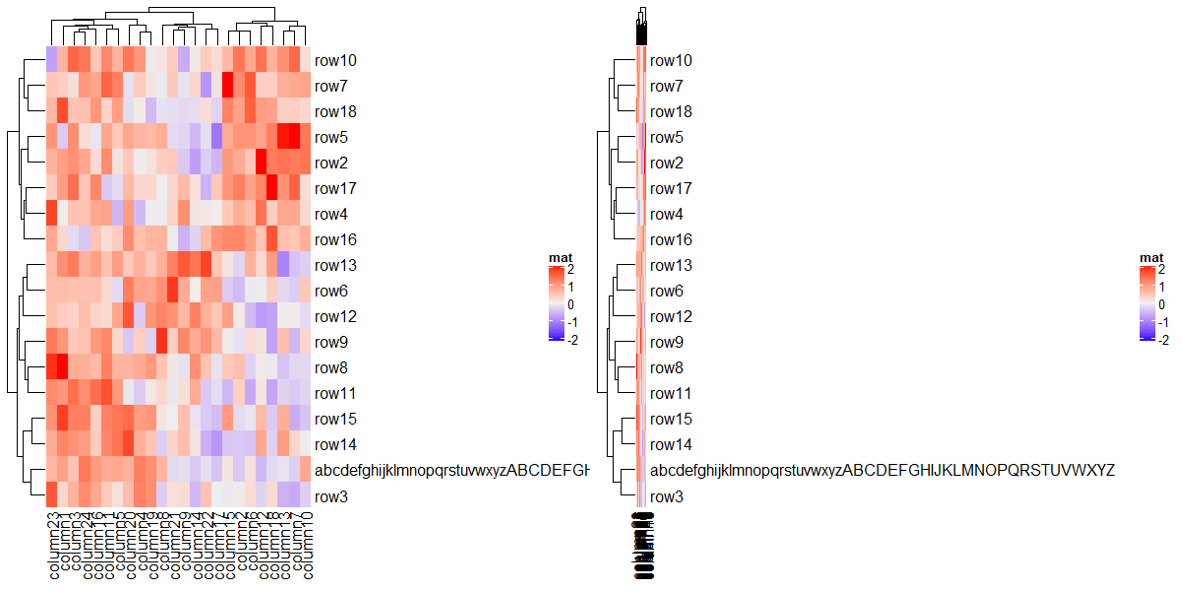
上面右图虽然过长的名字显示了,但是热图基本看不见了,这是由于存图时候的宽度过小,保存图片的时候宽度给足就可以了。
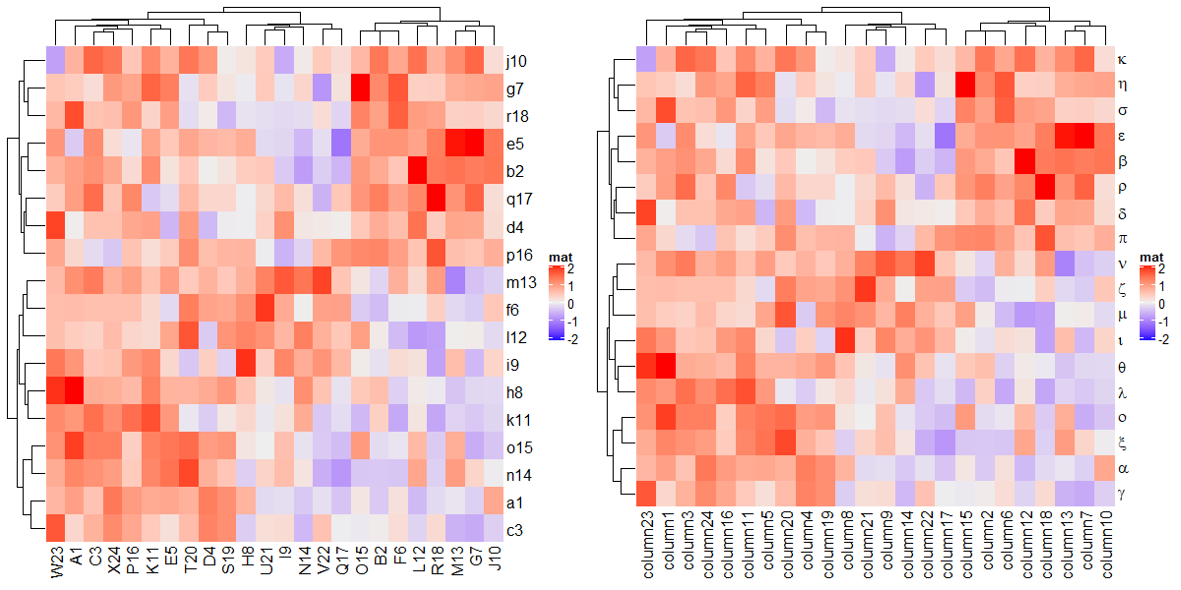
可以使用 row_labels/column_labels 修改行/列名,并且支持数学表达式。
row_labels = structure(paste0(letters[1:24], 1:24), names = paste0("row", 1:24))
column_labels = structure(paste0(LETTERS[1:24], 1:24), names = paste0("column", 1:24))
Heatmap(mat, name = "mat",
        row_labels = row_labels[rownames(mat)],
        column_labels = column_labels[colnames(mat)])

Heatmap(mat, name = "mat",
        row_labels = expression(alpha, beta, gamma, delta, epsilon,
                                zeta, eta, theta, iota, kappa, lambda,
                                mu, nu, xi, omicron, pi, rho, sigma))
1.6 Heatmap split
可以用来分割热图的参数有 row_km, row_split, column_km 和 column_split,下面会一一说明,注意理解示例即可。
1.6.1 Split by k-means clustering
Heatmap(mat, name = "mat",
        row_km = 2, # 行按照km分割

        column_km = 3) # 列按照km分割
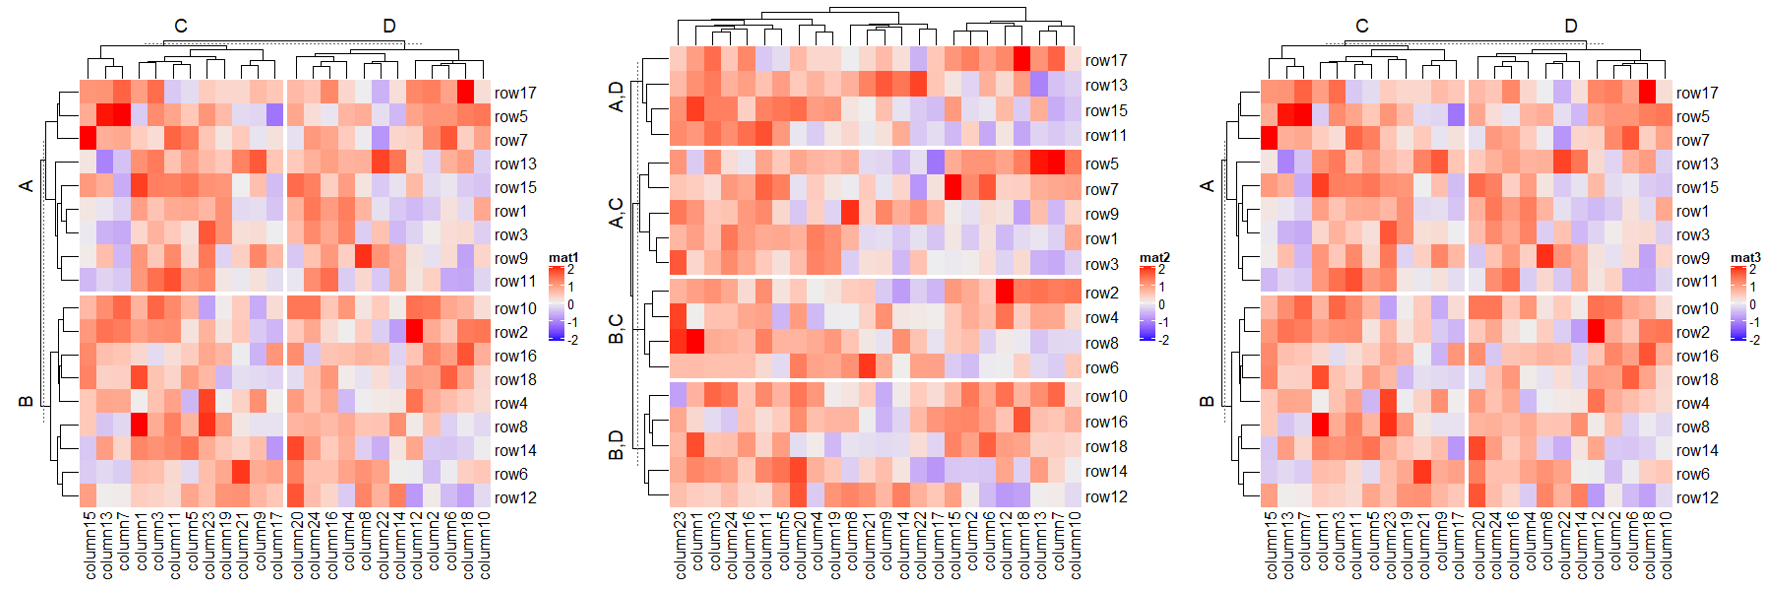
1.6.2 Split by categorical variables
# split by a vector

Heatmap(mat, name = "mat",
        row_split = rep(c("A", "B"), 9),
        column_split = rep(c("C", "D"), 12))

# split by a data frame

Heatmap(mat, name = "mat",
        row_split = data.frame(rep(c("A", "B"), 9),
                               rep(c("C", "D"), each = 9)))

# split on both dimensions

Heatmap(mat, name = "mat",
        row_split = factor(rep(c("A", "B"), 9)),
        column_split = factor(rep(c("C", "D"), 12)))
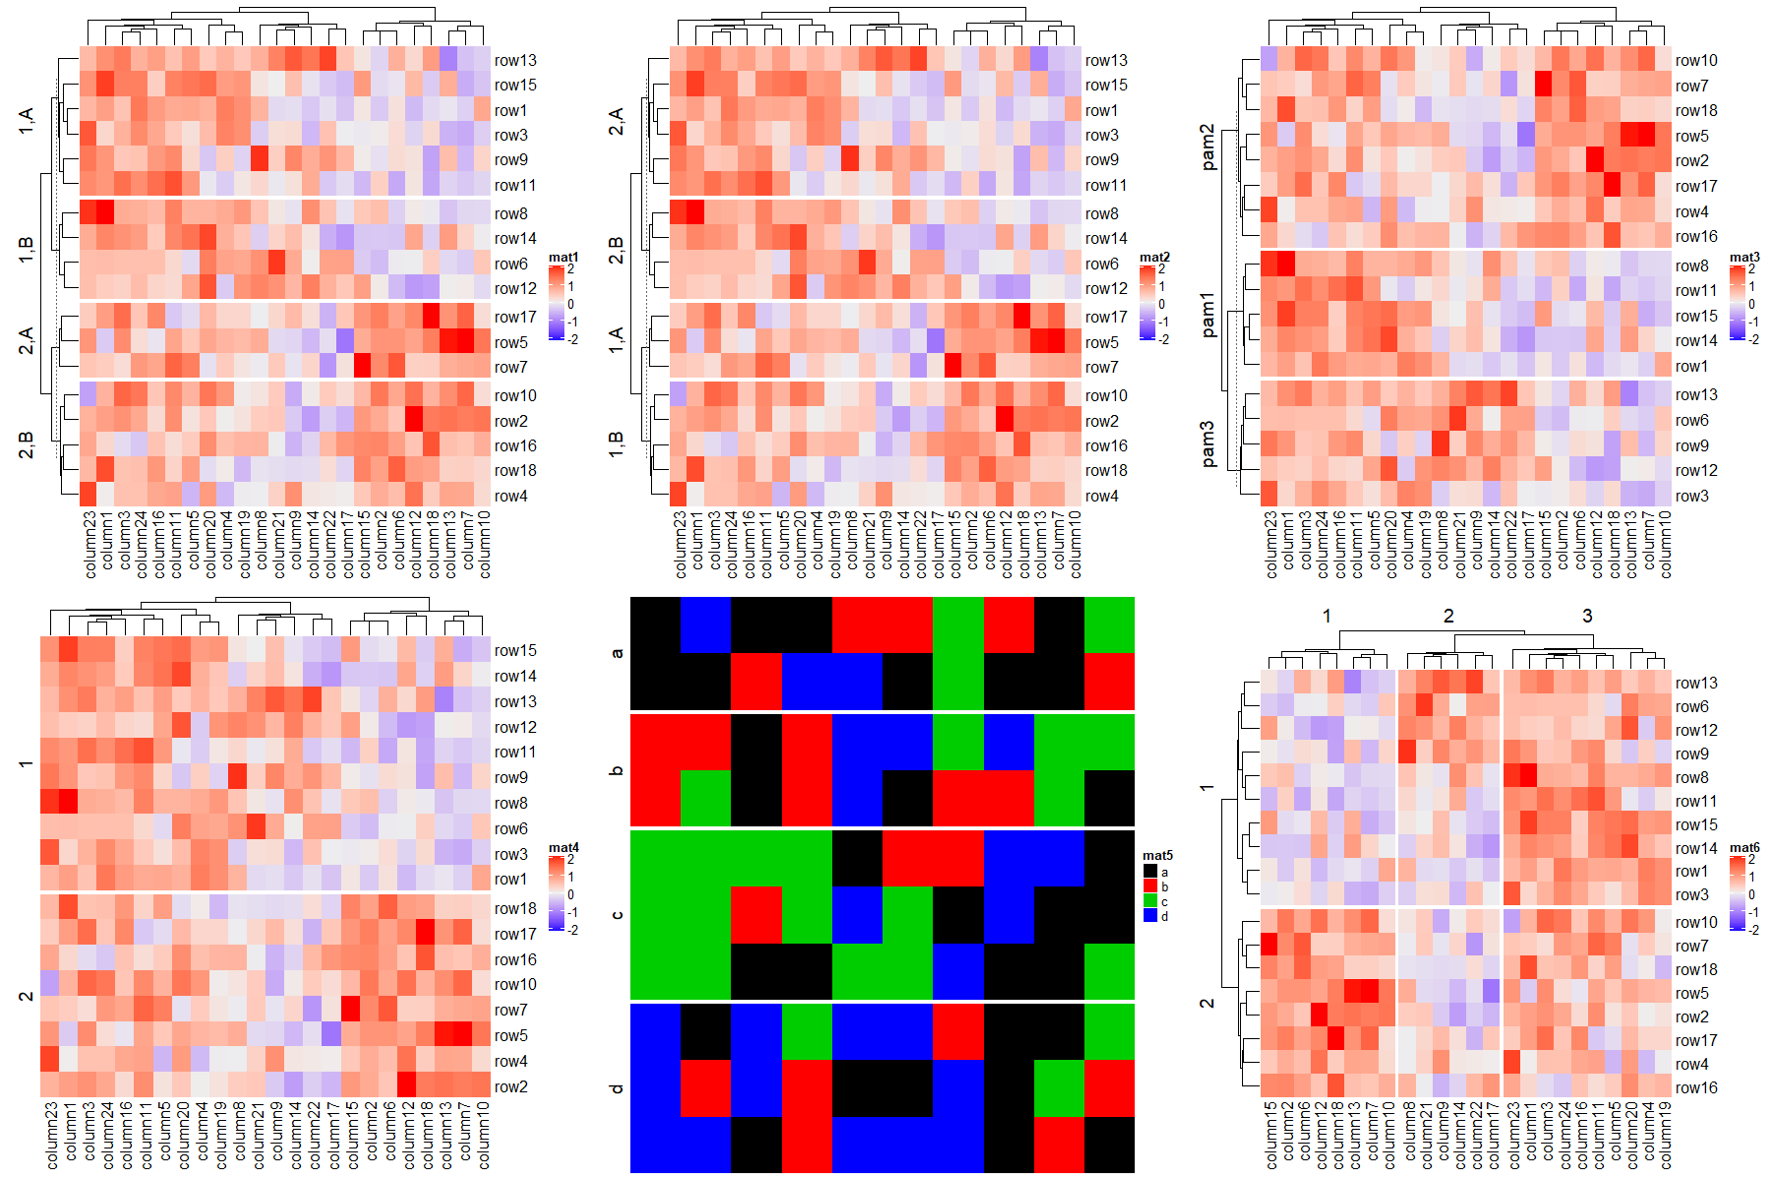
Heatmap(mat, name = "mat1",
        row_split = rep(c("A", "B"), 9),
        row_km = 2)

# 本质是split by a data frame

cl = kmeans(mat, centers = 2)$cluster
Heatmap(mat, name = "mat2", row_split = cbind(cl, rep(c("A", "B"), 9)))

# 本质是split by a vector

pa = cluster::pam(mat, k = 3)
Heatmap(mat, name = "mat3", row_split = paste0("pam", pa$clustering))

# remember when `row_order` is set, row clustering is turned off

Heatmap(mat, name = "mat4", row_order = 18:1, row_km = 2)


# Character matrix can only be split by row_split/column_split argument.

# split by the first column in `discrete_mat`

discrete_mat = matrix(sample(letters[1:4], 100, replace = TRUE), 10, 10)
Heatmap(discrete_mat, name = "mat5", col = 1:4, row_split = discrete_mat[, 1])

# 去除分割标记的虚线 show_parent_dend_line

Heatmap(mat, name = "mat6", row_km = 2, column_km = 3, show_parent_dend_line = FALSE)
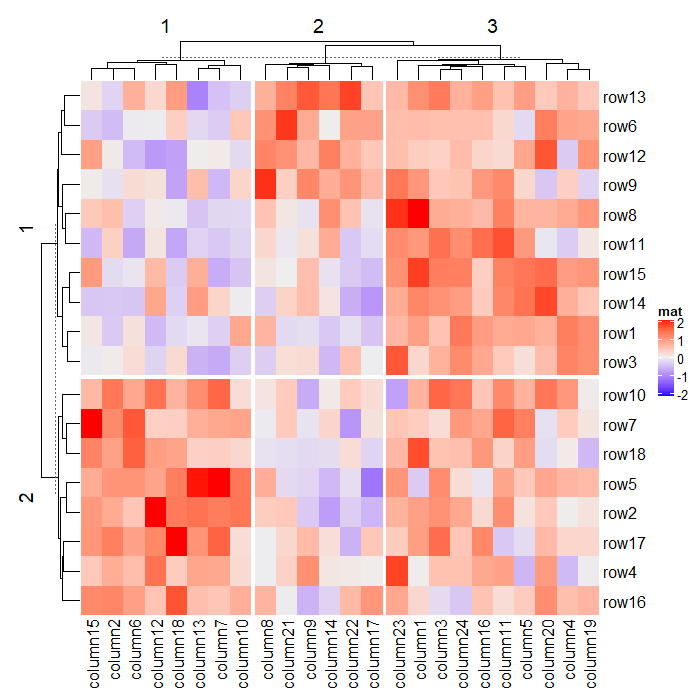
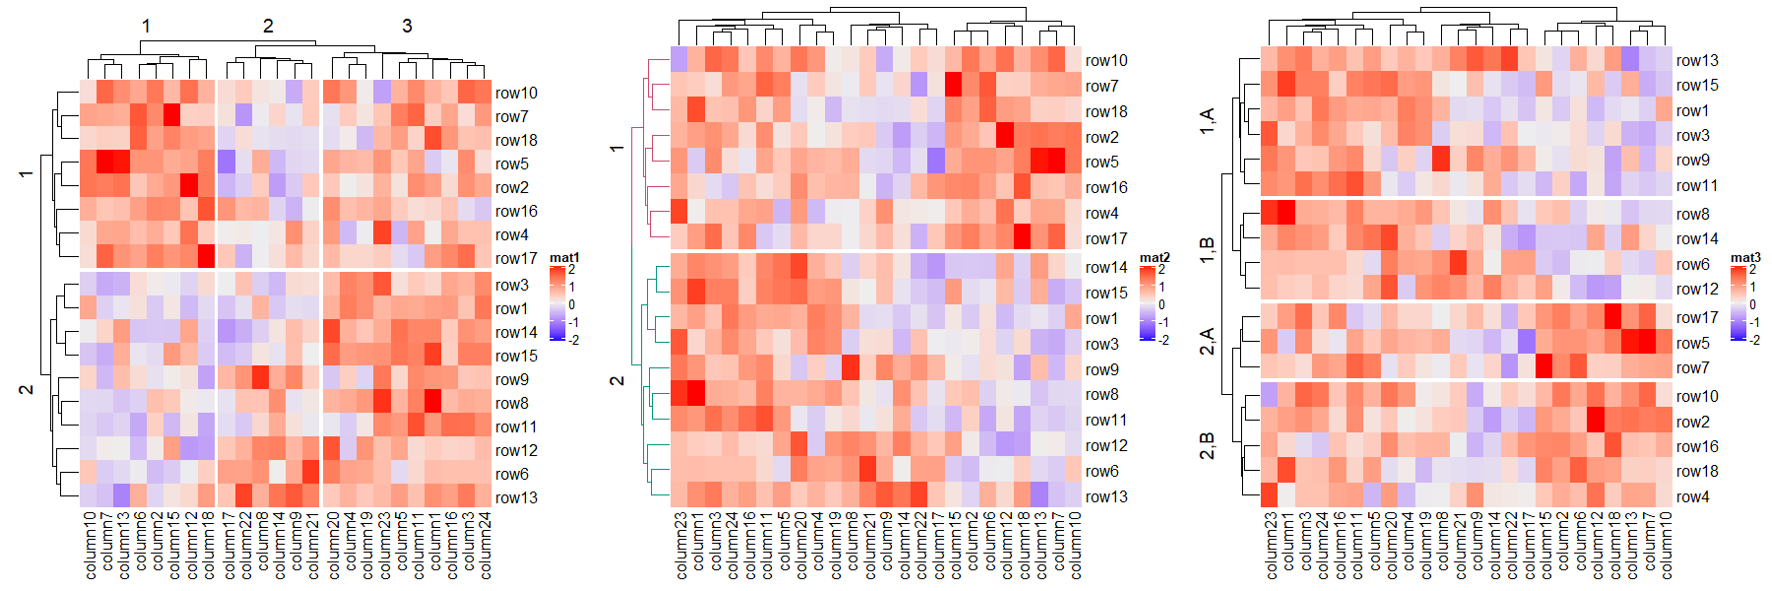
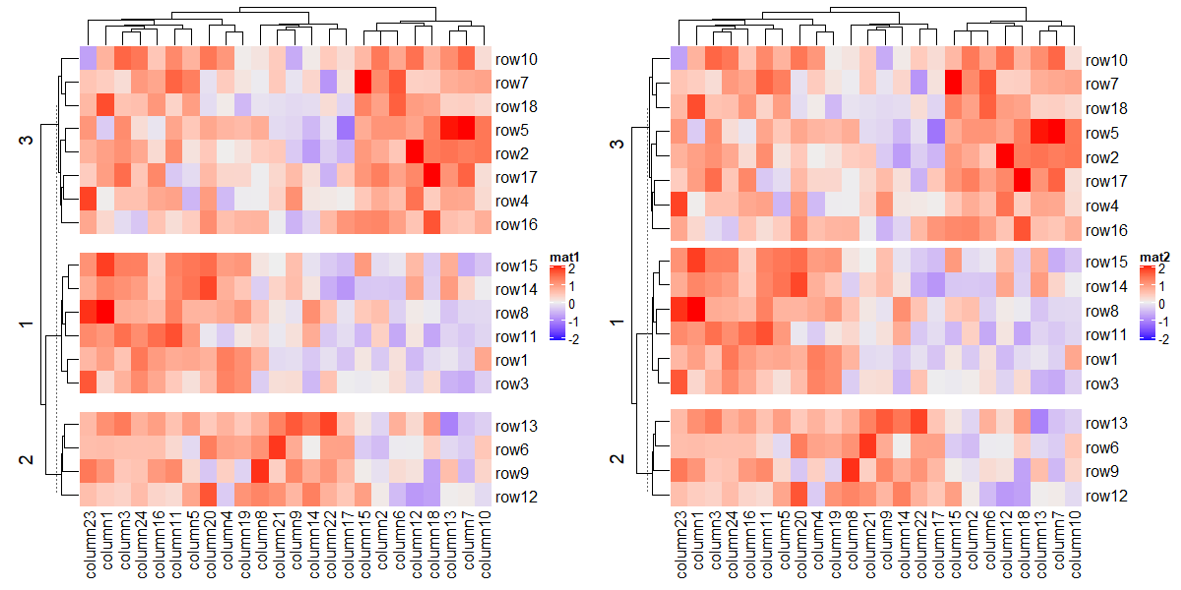
1.6.3 Split by dendrogram
Heatmap(mat, name = "mat1", row_split = 2, column_split = 3)

dend = hclust(dist(mat))
dend = dendextend::color_branches(dend, k = 2)
Heatmap(mat, name = "mat2", cluster_rows = dend, row_split = 2)

split = data.frame(cutree(hclust(dist(mat)), k = 2), rep(c("A", "B"), 9))
Heatmap(mat, name = "mat3", row_split = split, show_parent_dend_line = FALSE)
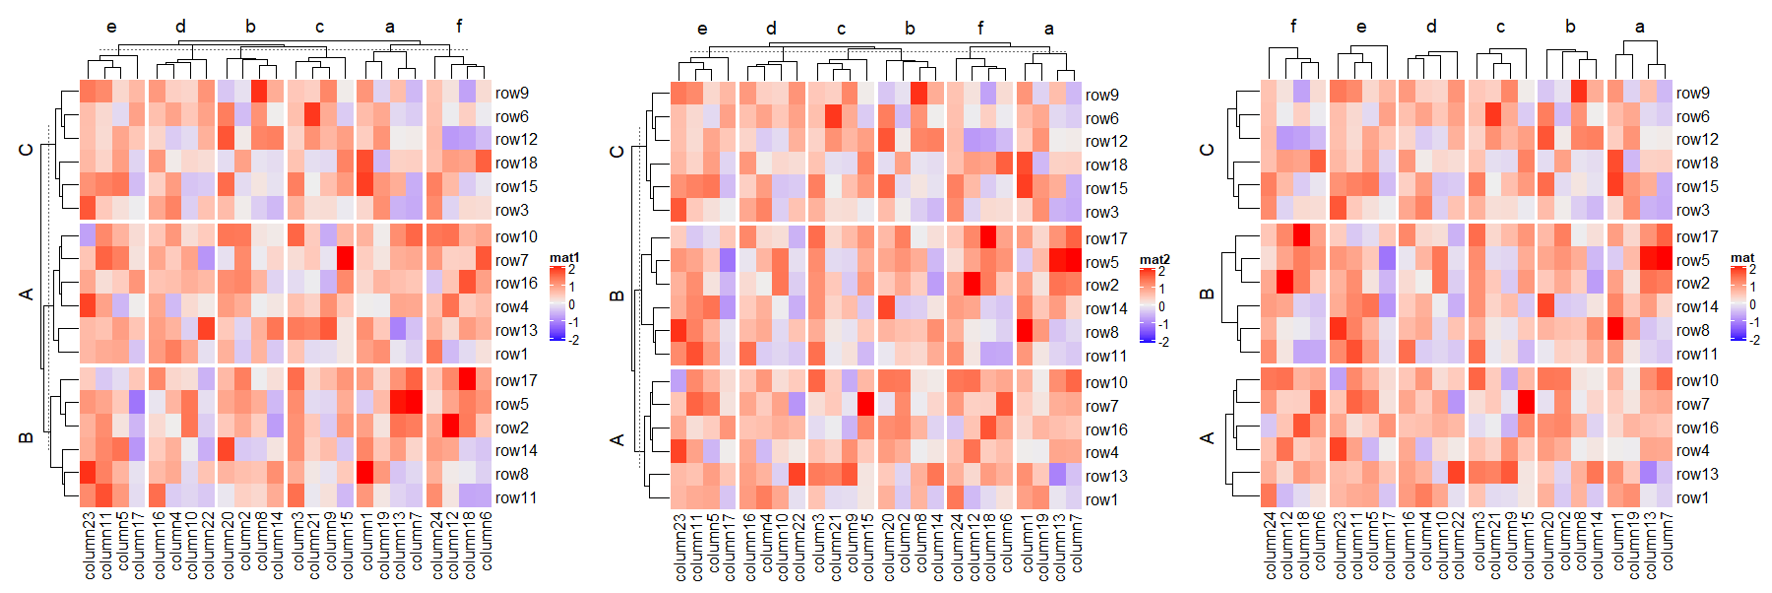
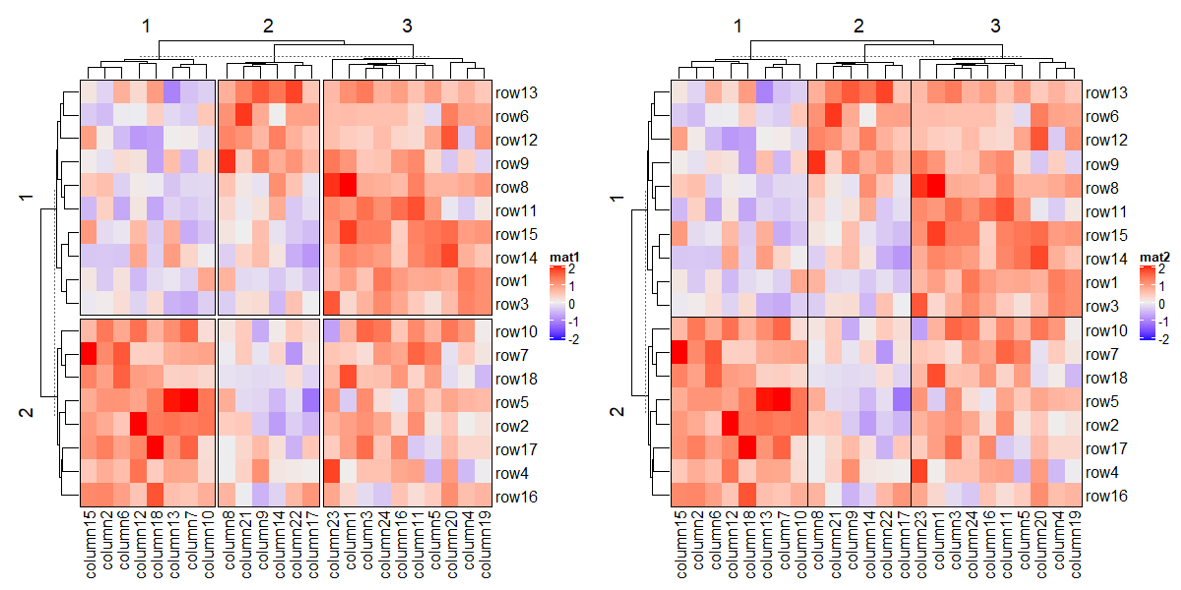
1.6.4 Order of slices
Heatmap(mat, name = "mat1",
        row_split = rep(LETTERS[1:3], 6),
        column_split = rep(letters[1:6], 4))

# clustering is similar as previous heatmap with branches in some nodes in the dendrogram flipped

Heatmap(mat, name = "mat2",
        row_split = factor(rep(LETTERS[1:3], 6), levels = LETTERS[3:1]),
        column_split = factor(rep(letters[1:6], 4), levels = letters[6:1]))

# 去除树图中分割标记的虚线以上的部分 cluster_row_slices/cluster_column_slices

# now the order is exactly what we set

Heatmap(mat, name = "mat",
        row_split = factor(rep(LETTERS[1:3], 6), levels = LETTERS[3:1]),
        column_split = factor(rep(letters[1:6], 4), levels = letters[6:1]),
        cluster_row_slices = FALSE,
        cluster_column_slices = FALSE)
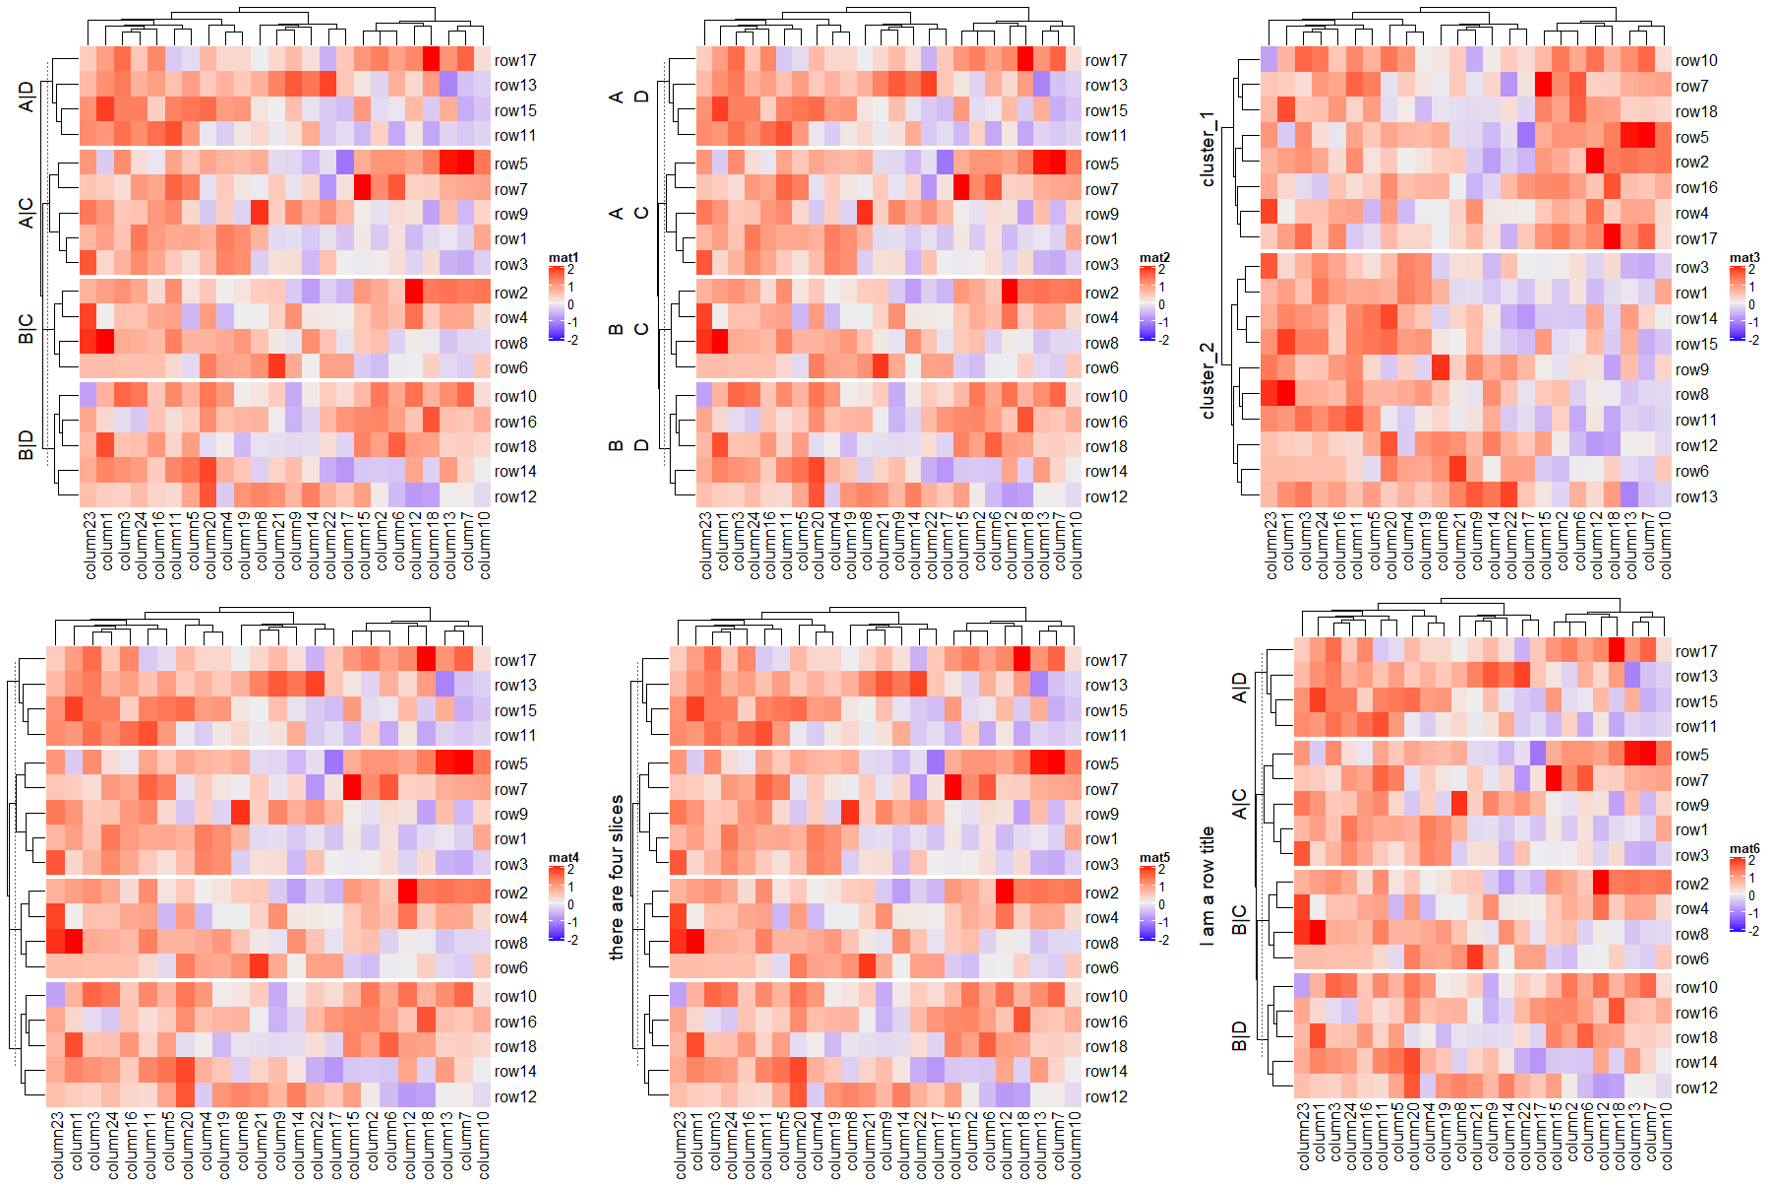
1.6.5 Titles for splitting
split = data.frame(rep(c("A", "B"), 9), rep(c("C", "D"), each = 9))
Heatmap(mat, name = "mat1", row_split = split, row_title = "%s|%s")
Heatmap(mat, name = "mat2", row_split = split, row_title = "%s\n%s")
Heatmap(mat, name = "mat3", row_split = 2, row_title = "cluster_%s")

Heatmap(mat, name = "mat4", row_split = split, row_title = NULL)
Heatmap(mat, name = "mat5", row_split = split, row_title = "there are four slices")
ht = Heatmap(mat, name = "mat6", row_split = split, row_title = "%s|%s")
draw(ht, row_title = "I am a row title")
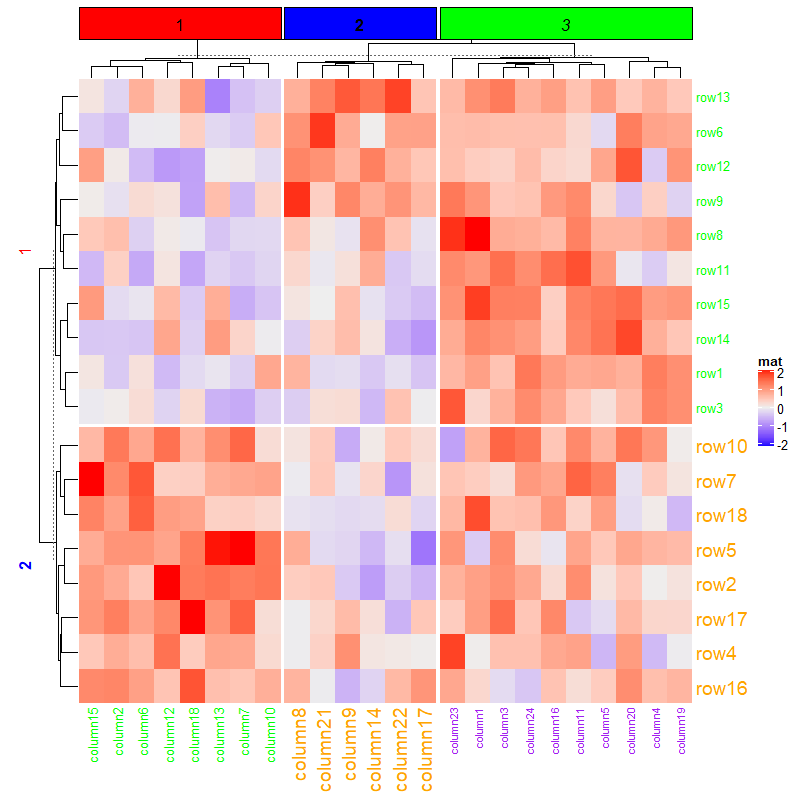
1.6.6 Graphic parameters for splitting
Heatmap(mat, name = "mat",
        row_km = 2, row_title_gp = gpar(col = c("red", "blue"), font = 1:2),
        row_names_gp = gpar(col = c("green", "orange"), fontsize = c(10, 14)),
        column_km = 3, column_title_gp = gpar(fill = c("red", "blue", "green"), font = 1:3),
        column_names_gp = gpar(col = c("green", "orange", "purple"), fontsize = c(10, 14, 8)))
1.6.7 Gaps between slices
Heatmap(mat, name = "mat1", row_km = 3, row_gap = unit(5, "mm"))
Heatmap(mat, name = "mat2", row_km = 3, row_gap = unit(c(2, 4), "mm"))
这里需要注意一下,分割后热图的边框就会改变。
Heatmap(mat, name = "mat1", row_km = 2, column_km = 3, border = TRUE)
Heatmap(mat, name = "mat2", row_km = 2, column_km = 3,
        row_gap = unit(0, "mm"), column_gap = unit(0, "mm"), border = TRUE)
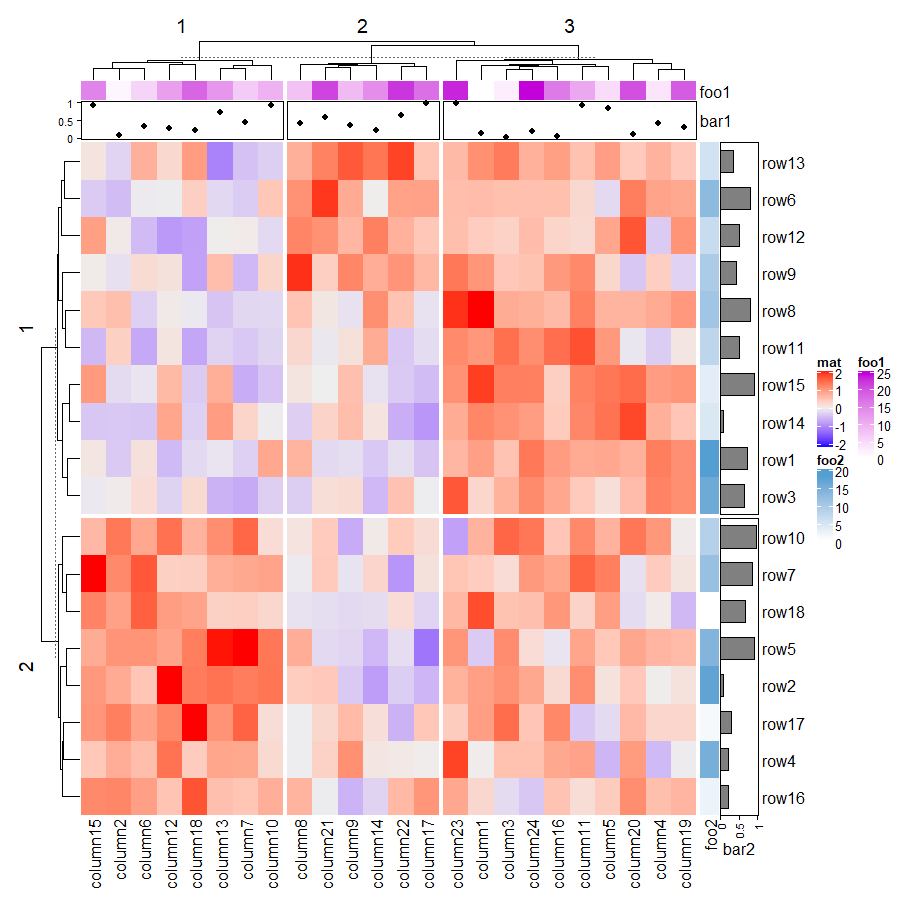
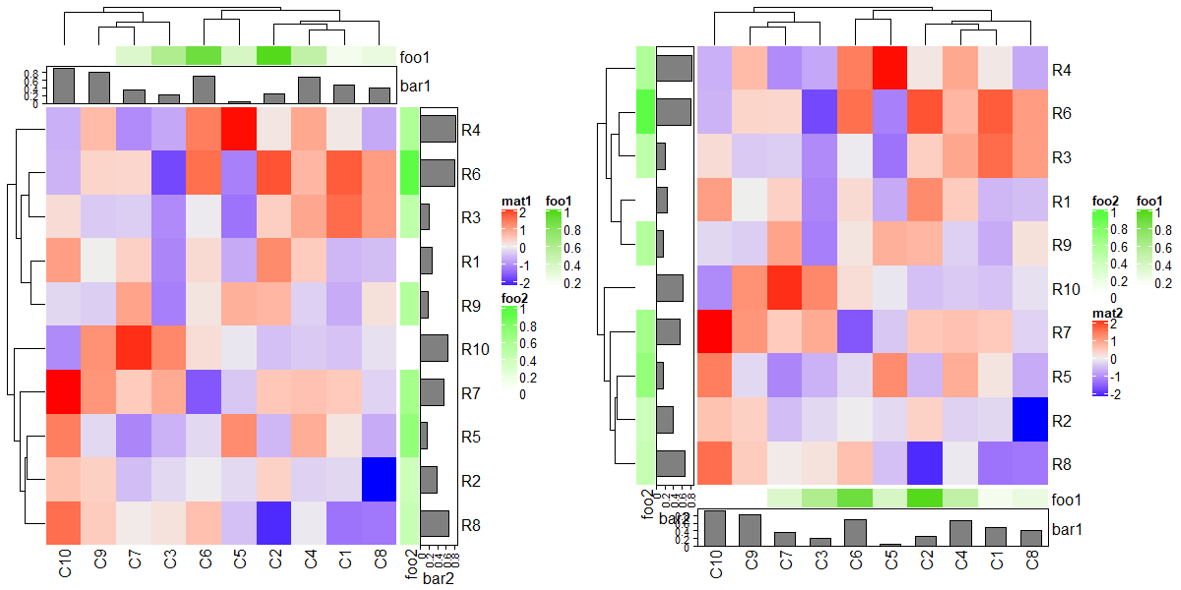
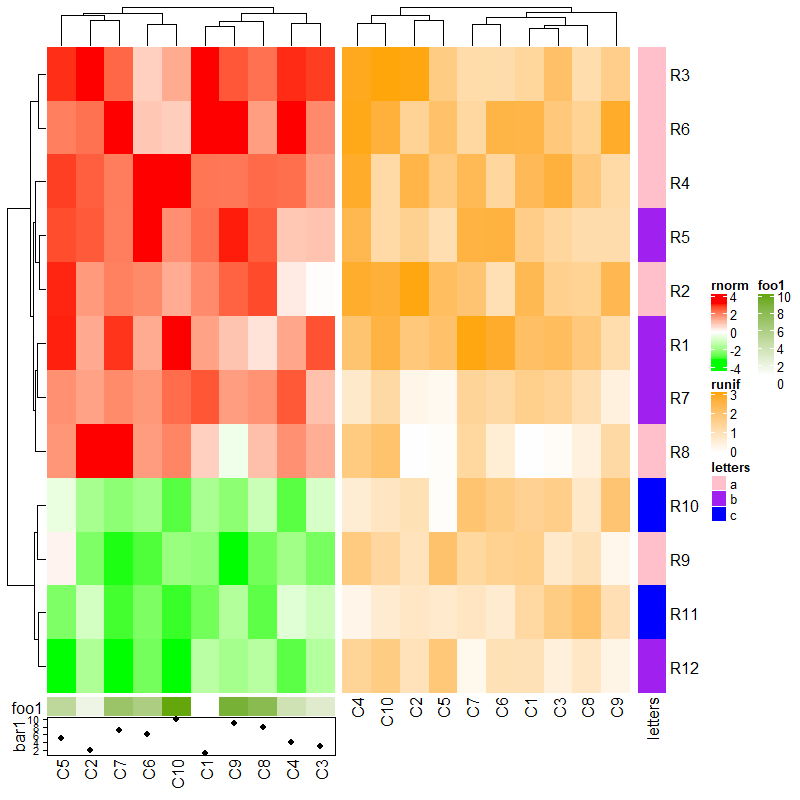
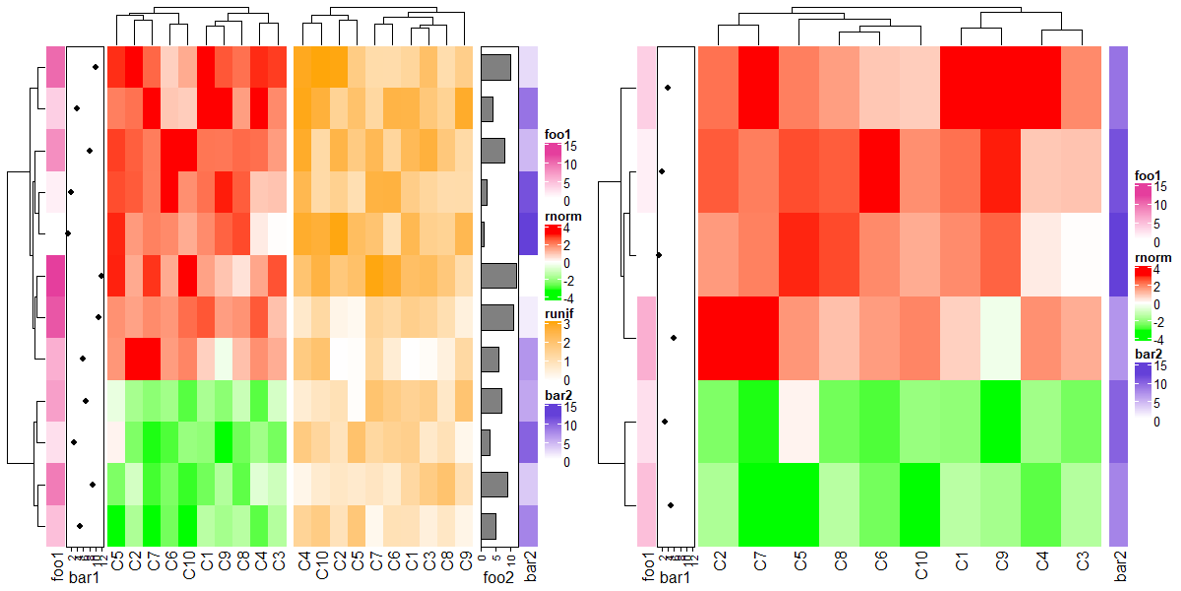
1.6.8 Split heatmap annotations
分割后注释也会随之分割。
Heatmap(mat, name = "mat", row_km = 2, column_km = 3,
        top_annotation = HeatmapAnnotation(foo1 = 1:24, bar1 = anno_points(runif(24))),
        right_annotation = rowAnnotation(foo2 = 18:1, bar2 = anno_barplot(runif(18)))
        )
1.7 Heatmap as raster image
这里主要是比较不同质量参数保存图片后的文件大小。
Heatmap(mat, use_raster = TRUE, raster_quality = 2)

set.seed(123)
mat2 = matrix(rnorm(10000*100), ncol = 100)
pdf("heatmap.pdf", width = 8, height = 8)
Heatmap(mat2, cluster_rows = FALSE, cluster_columns = FALSE, use_raster = FALSE)
dev.off()

pdf("heatmap_raster_by_png.pdf", width = 8, height = 8)
Heatmap(mat2, cluster_rows = FALSE, cluster_columns = FALSE, use_raster = TRUE,
        raster_device = "png")
dev.off()

pdf("heatmap_raster_by_jpeg.pdf", width = 8, height = 8)
Heatmap(mat2, cluster_rows = FALSE, cluster_columns = FALSE, use_raster = TRUE,
        raster_device = "jpeg")
dev.off()

pdf("heatmap_raster_by_tiff.pdf", width = 8, height = 8)
Heatmap(mat2, cluster_rows = FALSE, cluster_columns = FALSE, use_raster = TRUE,
        raster_device = "tiff")
dev.off()

pdf("heatmap_raster_by_CairoPNG.pdf", width = 8, height = 8)
Heatmap(mat2, cluster_rows = FALSE, cluster_columns = FALSE, use_raster = TRUE,
        raster_device = "CairoPNG")
dev.off()

pdf("heatmap_raster_by_CairoJPEG.pdf", width = 8, height = 8)
Heatmap(mat2, cluster_rows = FALSE, cluster_columns = FALSE, use_raster = TRUE,
        raster_device = "CairoJPEG")
dev.off

all_files = c("heatmap.pdf", "heatmap_raster_by_png.pdf",
              "heatmap_raster_by_jpeg.pdf", "heatmap_raster_by_tiff.pdf",
              "heatmap_raster_by_CairoPNG.pdf", "heatmap_raster_by_CairoJPEG.pdf")
fs = file.size(all_files)
names(fs) = all_files
sapply(fs, function(x) paste(round(x/1024), "KB"))
1.8 Customize the heatmap body
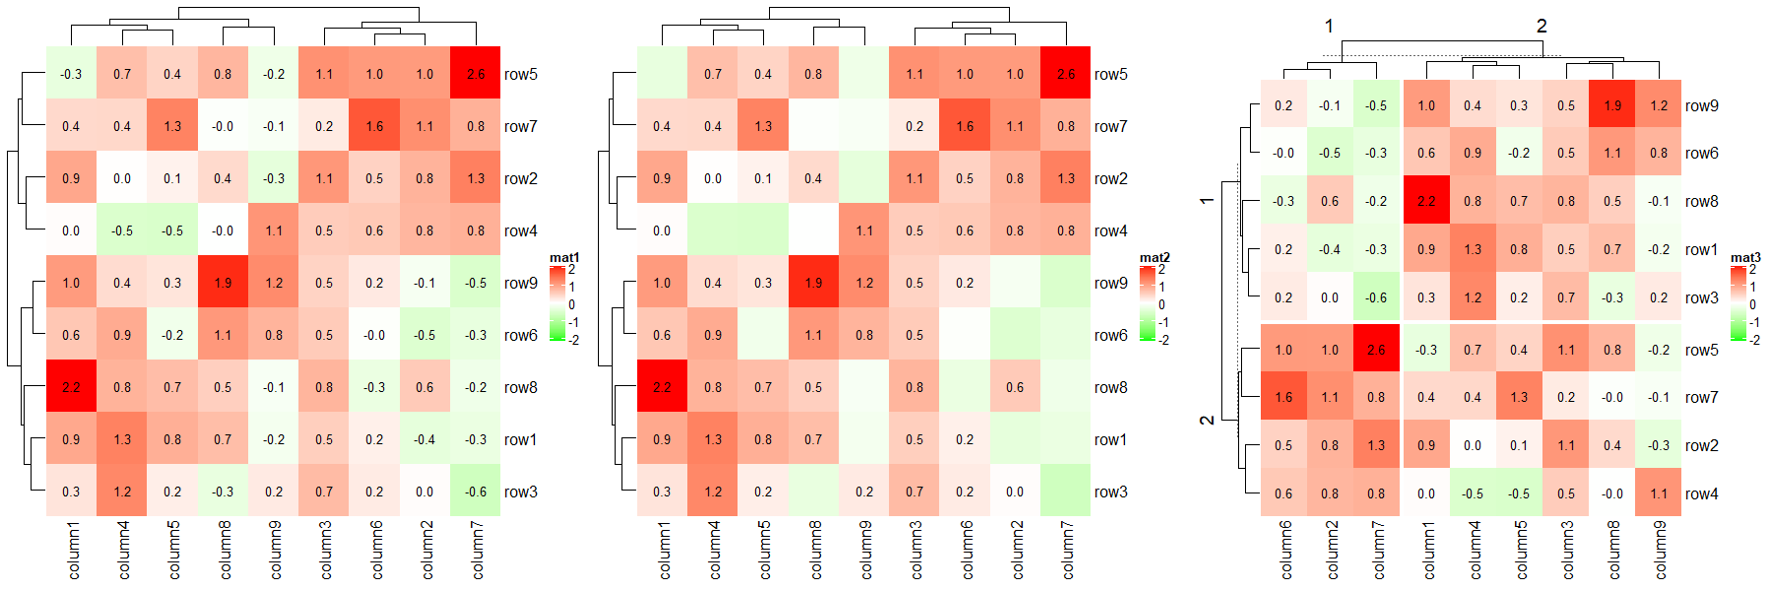
1.8.1 cell_fun
cell_fun draws in each cell repeatedly, with 7 arguments.
j: column index in the matrix. Column index corresponds to the x-direction in the viewport, that’s why j is put as the first argument.i: row index in the matrix.x: x coordinate of middle point of the cell which is measured in the viewport of the heatmap body.y: y coordinate of middle point of the cell which is measured in the viewport of the heatmap body.width: width of the cell. The value is unit(1/ncol(sub_mat), “npc”) where sub_mat correspond to the sub-matrix by row splitting and column splitting.height: height of the cell. The value is unit(1/nrow(sub_mat), “npc”).fill: color of the cell.
small_mat = mat[1:9, 1:9]
col_fun = circlize::colorRamp2(c(-2, 0, 2), c("green", "white", "red"))
Heatmap(small_mat, name = "mat1", col = col_fun,
        cell_fun = function(j, i, x, y, width, height, fill) {
          grid.text(sprintf("%.1f", small_mat[i, j]), x, y, gp = gpar(fontsize = 10))
        })

Heatmap(small_mat, name = "mat2",  col = col_fun,
        cell_fun = function(j, i, x, y, width, height, fill) {
          if(small_mat[i, j] > 0)
            grid.text(sprintf("%.1f", small_mat[i, j]), x, y, gp = gpar(fontsize = 10))
        })

Heatmap(small_mat, name = "mat3", col = col_fun,
        row_km = 2, column_km = 2,
        cell_fun = function(j, i, x, y, width, height, fill) {
          grid.text(sprintf("%.1f", small_mat[i, j]), x, y, gp = gpar(fontsize = 10))
        })
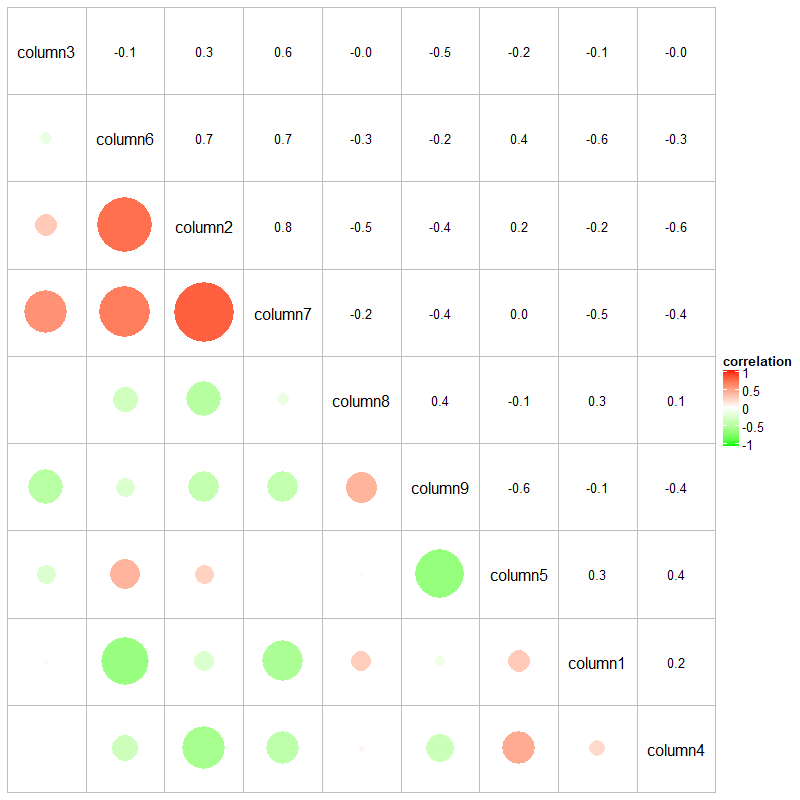
cor_mat = cor(small_mat)
od = hclust(dist(cor_mat))$order
cor_mat = cor_mat[od, od]
nm = rownames(cor_mat)
col_fun = circlize::colorRamp2(c(-1, 0, 1), c("green", "white", "red"))
# `col = col_fun` here is used to generate the legend

Heatmap(cor_mat, name = "correlation", col = col_fun, rect_gp = gpar(type = "none"),
        cell_fun = function(j, i, x, y, width, height, fill) {
          grid.rect(x = x, y = y, width = width, height = height,
                    gp = gpar(col = "grey", fill = NA))
          if(i == j) {
            grid.text(nm[i], x = x, y = y)
          } else if(i > j) {
            grid.circle(x = x, y = y, r = abs(cor_mat[i, j])/2 * min(unit.c(width, height)),
                        gp = gpar(fill = col_fun(cor_mat[i, j]), col = NA))
          } else {
            grid.text(sprintf("%.1f", cor_mat[i, j]), x, y, gp = gpar(fontsize = 10))
          }
        }, cluster_rows = FALSE, cluster_columns = FALSE,
        show_row_names = FALSE, show_column_names = FALSE)
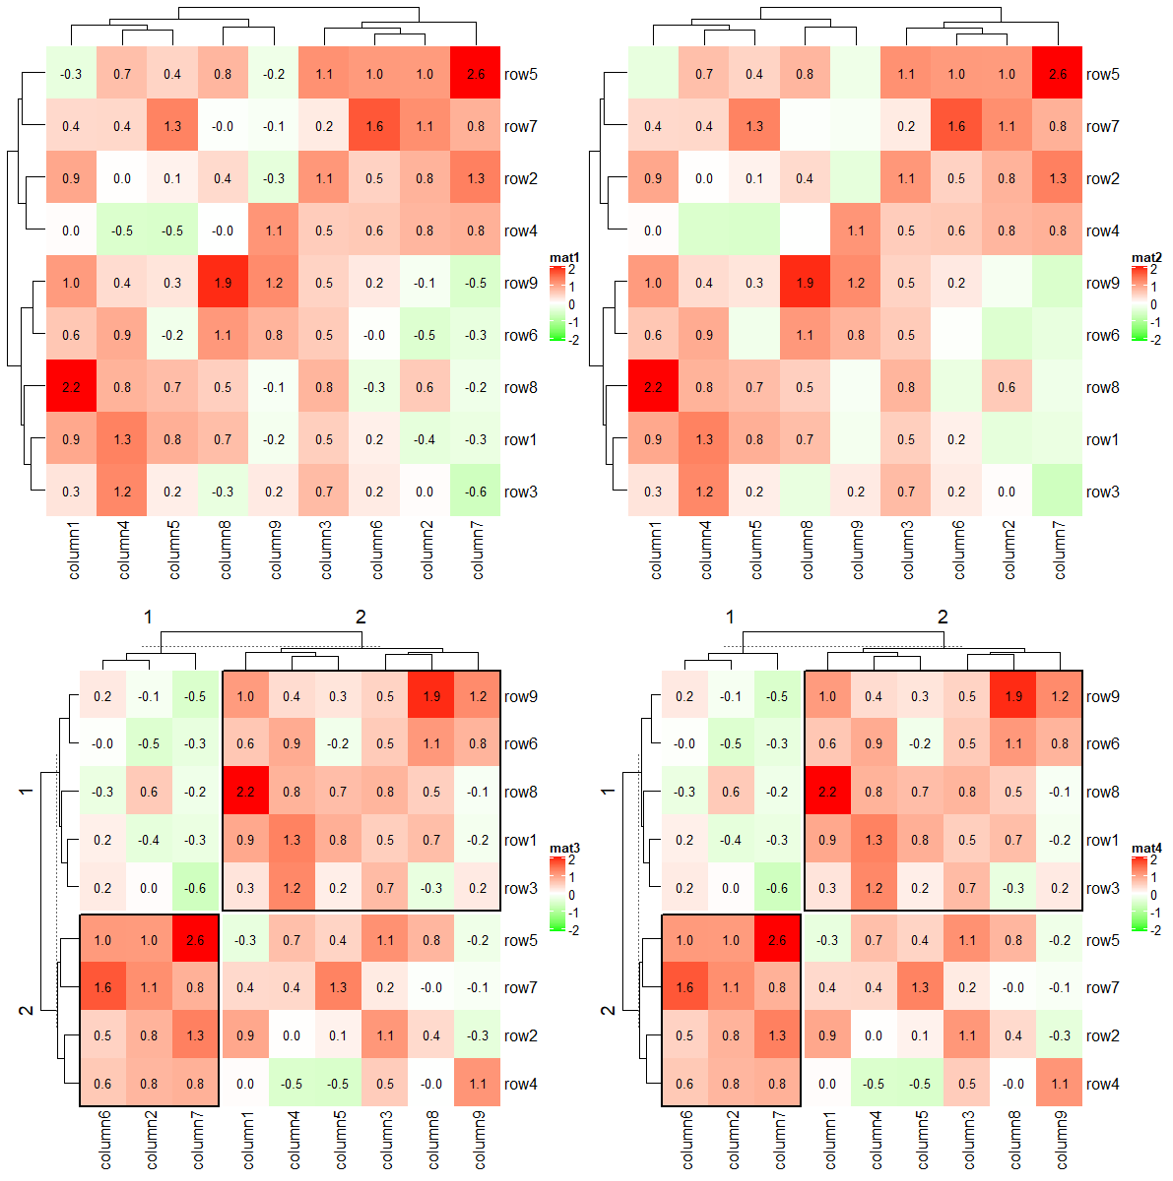
1.8.2 layer_fun
cell_fun adds graphics cell by cell, while layer_fun adds graphics in a block-wise manner.
mfoo = matrix(1:9, nr = 3)
mfoo[1:2, c(1, 3)]
# but we actually want mfoo[1, 1] and mfoo[2, 3]

pindex(mfoo, 1:2, c(1, 3))

col_fun = circlize::colorRamp2(c(-2, 0, 2), c("green", "white", "red"))
Heatmap(small_mat, name = "mat1", col = col_fun,
        layer_fun = function(j, i, x, y, width, height, fill) {
          # since grid.text can also be vectorized

          grid.text(sprintf("%.1f", pindex(small_mat, i, j)), x, y, gp = gpar(fontsize = 10))
        })

Heatmap(small_mat, name = "mat2", col = col_fun,
        layer_fun = function(j, i, x, y, width, height, fill) {
          v = pindex(small_mat, i, j)
          l = v > 0
          grid.text(sprintf("%.1f", v[l]), x[l], y[l], gp = gpar(fontsize = 10))
        })

Heatmap(small_mat, name = "mat3", col = col_fun,
        row_km = 2, column_km = 2,
        layer_fun = function(j, i, x, y, width, height, fill) {
          v = pindex(small_mat, i, j)
          grid.text(sprintf("%.1f", v), x, y, gp = gpar(fontsize = 10))
          if(sum(v > 0)/length(v) > 0.75) {
            grid.rect(gp = gpar(lwd = 2, fill = "transparent"))
          }
        })

Heatmap(small_mat, name = "mat4", col = col_fun,
        row_km = 2, column_km = 2,
        layer_fun = function(j, i, x, y, width, height, fill, slice_r, slice_c) {
          v = pindex(small_mat, i, j)
          grid.text(sprintf("%.1f", v), x, y, gp = gpar(fontsize = 10))
          if(slice_r != slice_c) {
            grid.rect(gp = gpar(lwd = 2, fill = "transparent"))
          }
        })
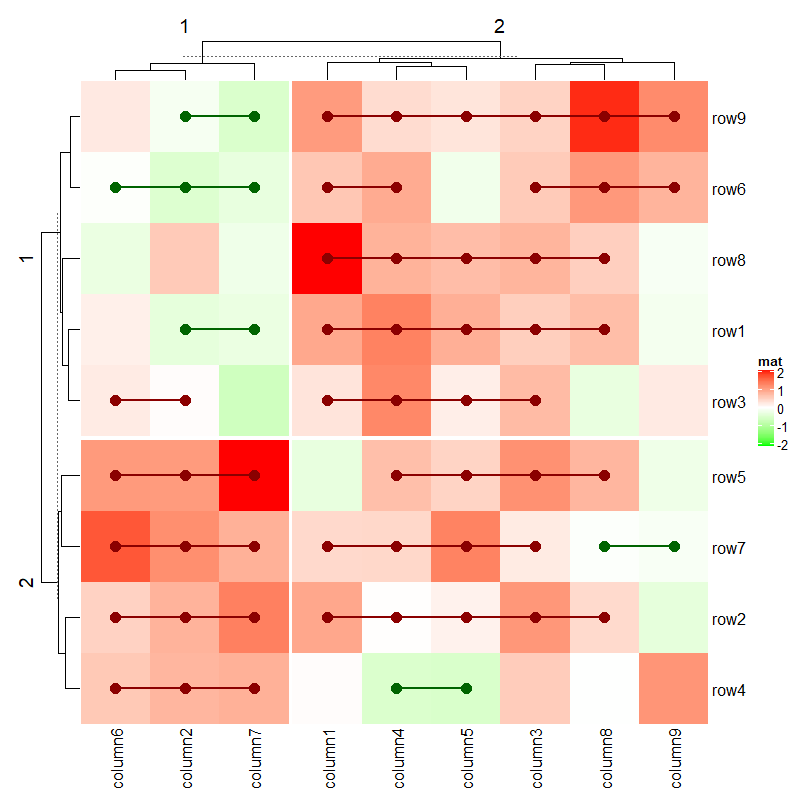
Heatmap(small_mat, name = "mat", col = col_fun,
        row_km = 2, column_km = 2,
        layer_fun = function(j, i, x, y, w, h, fill) {
          # restore_matrix() is explained after this chunk of code

          ind_mat = restore_matrix(j, i, x, y)
          for(ir in seq_len(nrow(ind_mat))) {
            # start from the second column

            for(ic in seq_len(ncol(ind_mat))[-1]) {
              ind1 = ind_mat[ir, ic-1] # previous column

              ind2 = ind_mat[ir, ic]   # current column

              v1 = small_mat[i[ind1], j[ind1]]
              v2 = small_mat[i[ind2], j[ind2]]
              if(v1 * v2 > 0) { # if they have the same sign

                col = ifelse(v1 > 0, "darkred", "darkgreen")
                grid.segments(x[ind1], y[ind1], x[ind2], y[ind2],
                              gp = gpar(col = col, lwd = 2))
                grid.points(x[c(ind1, ind2)], y[c(ind1, ind2)],
                            pch = 16, gp = gpar(col = col), size = unit(4, "mm"))
              }
            }
          }
        })
1.9 Size of the heatmap
# 控制热图主体尺寸

Heatmap(mat, name = "mat1", width = unit(8, "cm"), height = unit(8, "cm"))

# 控制热图尺寸(包括注释和图例)

Heatmap(mat, name = "mat2", heatmap_width = unit(8, "cm"), heatmap_height = unit(8, "cm"))
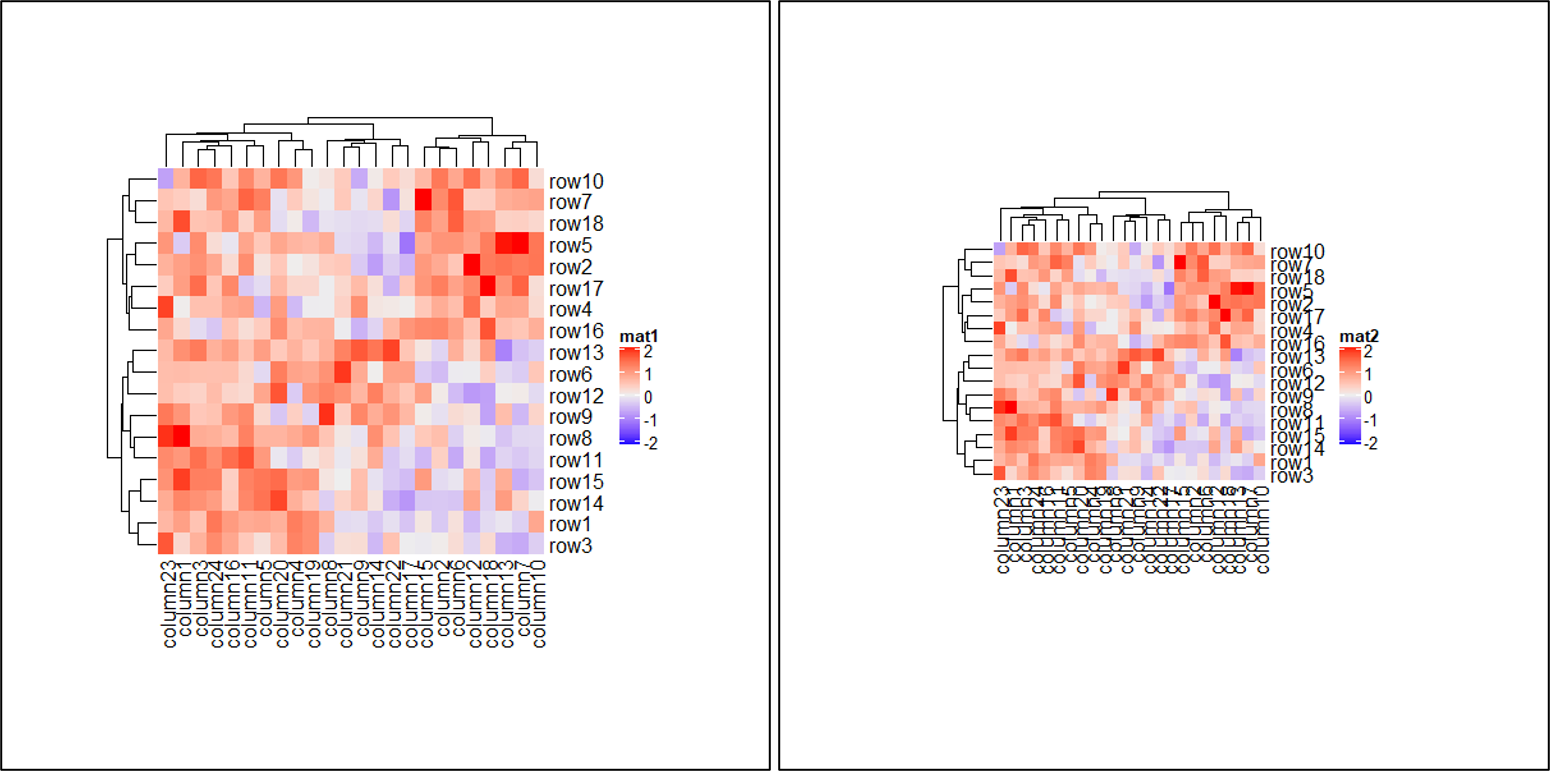
为了更加明显的展示尺寸关系,上图是以 600·600 的大小保存的,并在后期加上黑边框。
1.10 Get orders and dendrograms
ht = Heatmap(small_mat)
ht = draw(ht)

row_order(ht)
column_order(ht)
1.11 Subset a heatmap
ht = Heatmap(mat, name = "mat", row_km = 2)
ht
ht[1:10, 1:10]
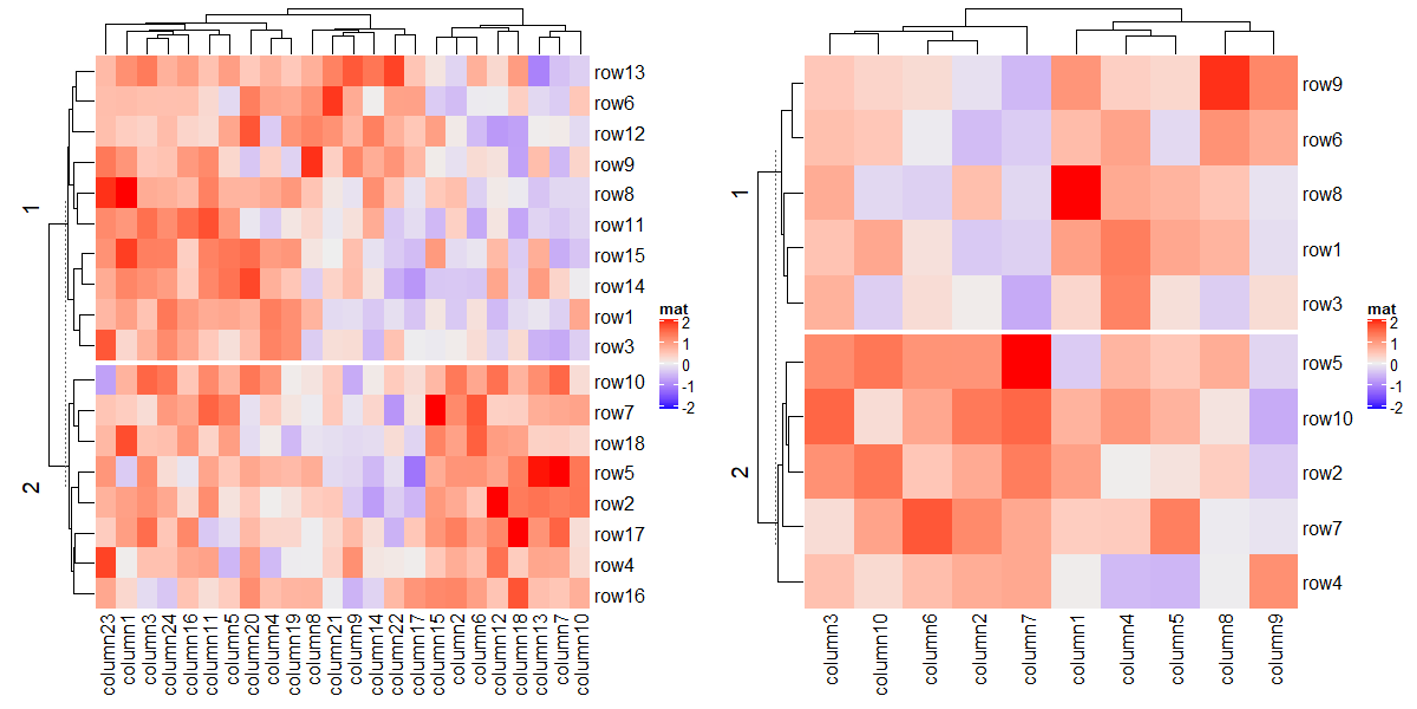
上图可以看出来,此功能本质是取输入的矩阵的子集,再画热图。换个思路,在括号中填入所需顺序,此功能不就可以实现在不聚类的情况下的重新排序吗!
2 Heatmap Annotations
正式开始说明之前,先准备一下矩阵和简单秀下画热图注释的相关代码。
# 构建矩阵

rm(list = ls())
set.seed(123)
mat = matrix(rnorm(100), 10)
rownames(mat) = paste0("R", 1:10)
colnames(mat) = paste0("C", 1:10)
column_ha = HeatmapAnnotation(foo1 = runif(10), bar1 = anno_barplot(runif(10)))
row_ha = rowAnnotation(foo2 = runif(10), bar2 = anno_barplot(runif(10)))
Heatmap(mat, name = "mat", top_annotation = column_ha, right_annotation = row_ha)

Heatmap(mat, name = "mat", bottom_annotation = column_ha, left_annotation = row_ha)
2.1 Simple annotation
简单注释,就是利用不同颜色来展示行/列中不同的信息。
# 用1到10作注释

ha = HeatmapAnnotation(foo = 1:10)
draw(ha)

# 用abc字母作注释

ha = HeatmapAnnotation(bar = sample(letters[1:3], 10, replace = TRUE))
draw(ha)

# 渐变色映射1到10作注释

col_fun = circlize::colorRamp2(c(0, 5, 10), c("blue", "white", "red"))
ha = HeatmapAnnotation(foo = 1:10, col = list(foo = col_fun))
draw(ha)

# abc字母作注释并分别指定不同的颜色

ha = HeatmapAnnotation(bar = sample(letters[1:3], 10, replace = TRUE),
                       col = list(bar = c("a" = "red", "b" = "green", "c" = "blue")))
draw(ha)

# 组合前面两种注释,并分别指定不同的颜色

ha = HeatmapAnnotation(
  foo = 1:10,
  bar = sample(letters[1:3], 10, replace = TRUE),
  col = list(foo = col_fun,
             bar = c("a" = "red", "b" = "green", "c" = "blue")
  )
)
draw(ha)
下图依次是上面五种示例的结果:
# NA value
ha = HeatmapAnnotation(
foo = c(1:4, NA, 6:10),
bar = c(NA, sample(letters[1:3], 9, replace = TRUE)),
col = list(foo = col_fun,
bar = c("a" = "red", "b" = "green", "c" = "blue")),
na_col = "black"
)
draw(ha)
# 每个格子的边框
ha = HeatmapAnnotation(
foo = 1:10,
bar = sample(letters[1:3], 10, replace = TRUE),
col = list(foo = col_fun,
bar = c("a" = "red", "b" = "green", "c" = "blue")
),
gp = gpar(col = "black")
)
draw(ha)
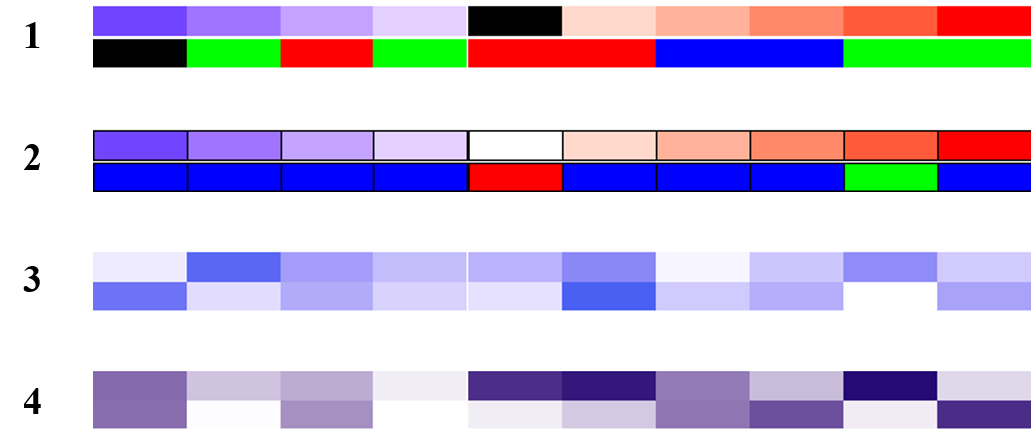
# 两行注释的两种方式
ha = HeatmapAnnotation(foo = cbind(a = runif(10), b = runif(10)))
draw(ha)
ha = HeatmapAnnotation(foo = cbind(runif(10), runif(10)))
draw(ha)
下图依次是上面四种示例的结果:
# 制作数据框传入

anno_df = data.frame(foo = 1:10,
                     bar = sample(letters[1:3], 10, replace = TRUE))
ha = HeatmapAnnotation(df = anno_df,
                       col = list(foo = col_fun,
                                  bar = c("a" = "red", "b" = "green", "c" = "blue")
                       )
)
draw(ha)

# 数据框和额外注释

ha = HeatmapAnnotation(df = anno_df,
                       foo2 = rnorm(10),
                       col = list(foo = col_fun,
                                  bar = c("a" = "red", "b" = "green", "c" = "blue")
                       )
)
draw(ha)

# 每个注释的边框 border

ha = HeatmapAnnotation(
  foo = cbind(1:10, 10:1),
  bar = sample(letters[1:3], 10, replace = TRUE),
  col = list(foo = col_fun,
             bar = c("a" = "red", "b" = "green", "c" = "blue")
  ),
  border = TRUE
)
draw(ha)

# 注释的尺寸 simple_anno_size

ha = HeatmapAnnotation(
  foo = cbind(a = 1:10, b = 10:1),
  bar = sample(letters[1:3], 10, replace = TRUE),
  col = list(foo = col_fun,
             bar = c("a" = "red", "b" = "green", "c" = "blue")
  ),
  simple_anno_size = unit(3, "cm")
)
draw(ha)
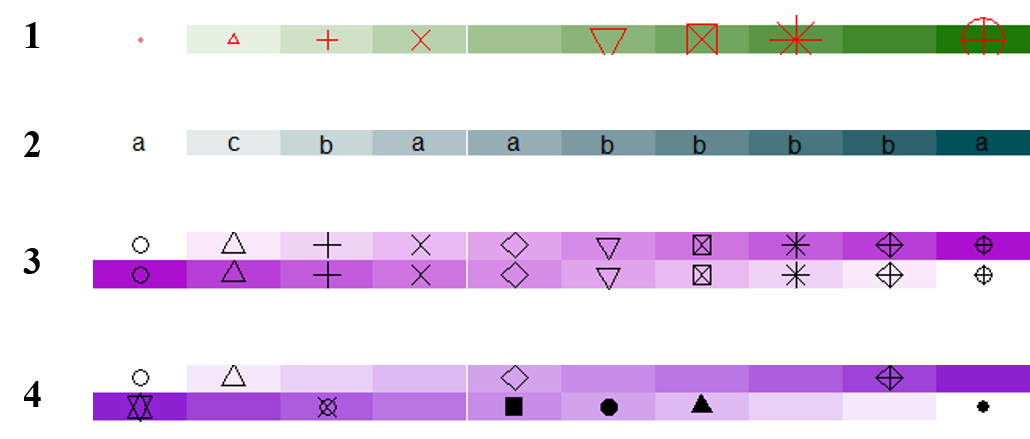
下图依次是上面四种示例的结果:
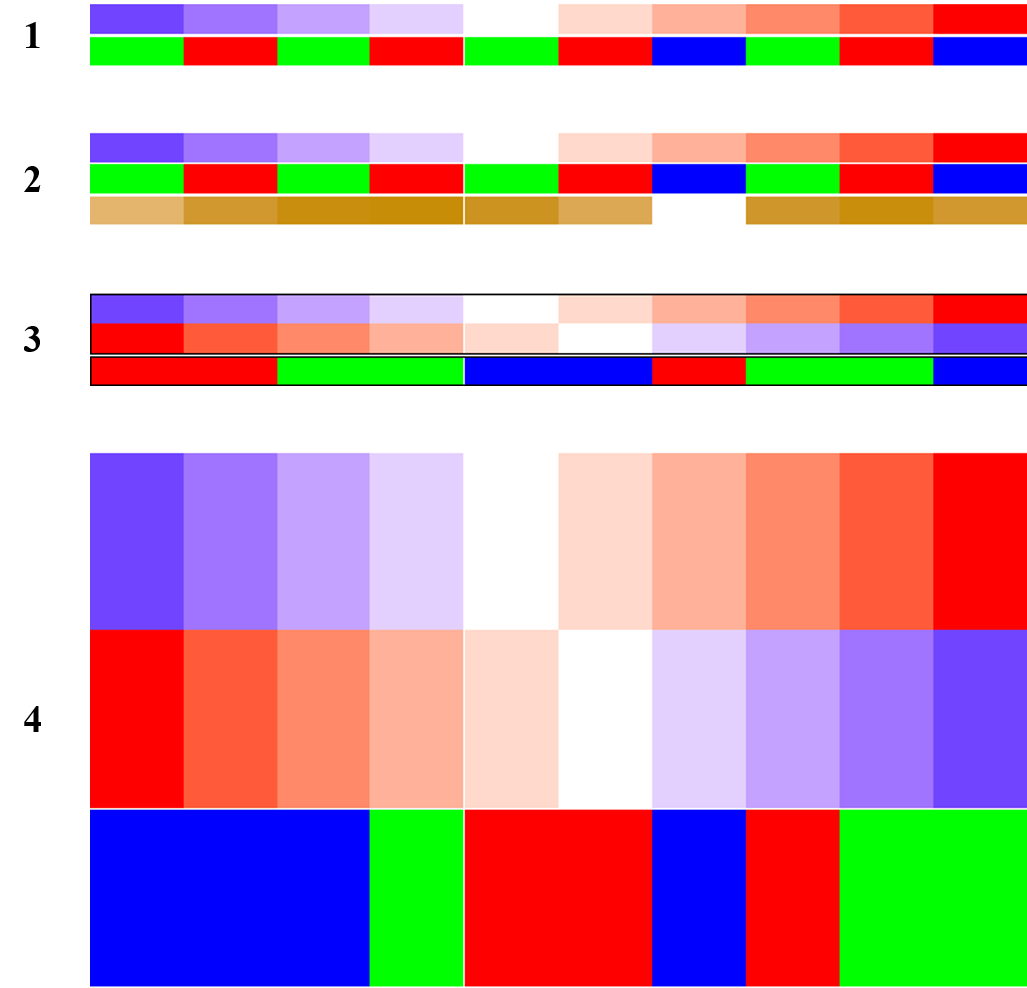
2.2 Simple annotation as an annotation function
ha = HeatmapAnnotation(foo = anno_simple(1:10,
                                         pch = c(1:4, NA, 6:8, NA, 10, 11), #形状

                                         pt_gp = gpar(col = "red"), pt_size = unit(1:10, "mm")))
draw(ha)

ha = HeatmapAnnotation(foo = anno_simple(1:10,
                                         pch = sample(letters[1:3], 10, replace = TRUE)))
draw(ha)

ha = HeatmapAnnotation(foo = anno_simple(cbind(1:10, 10:1), pch = 1:10))
draw(ha)

# pch通过matrix传入

pch = matrix(1:20, nc = 2)
pch[sample(length(pch), 10)] = NA
ha = HeatmapAnnotation(foo = anno_simple(cbind(1:10, 10:1), pch = pch))
draw(ha)
下图依次是上面四种示例的结果:
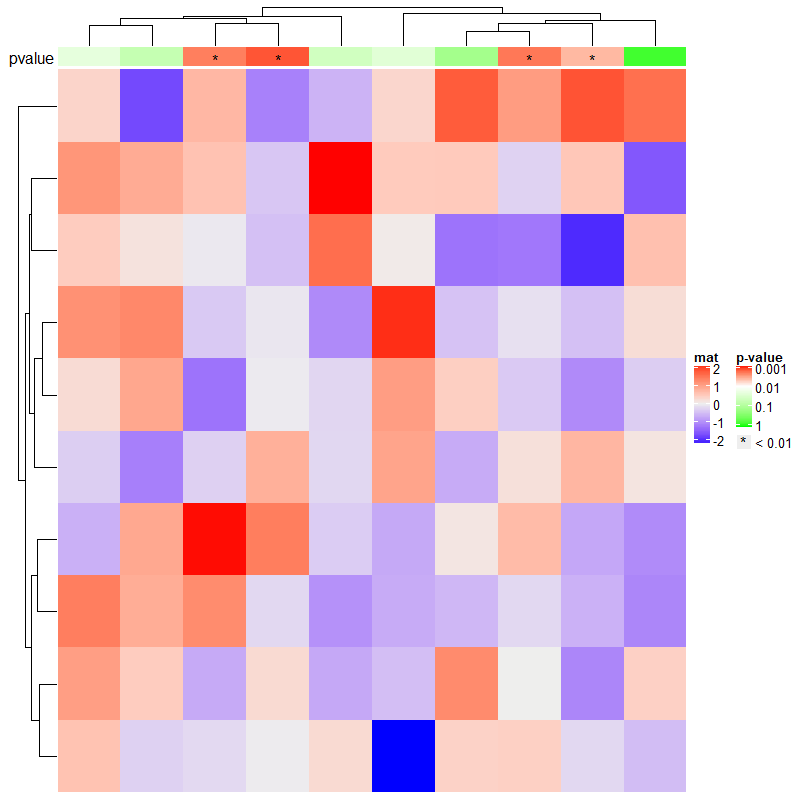
set.seed(123)
pvalue = 10^-runif(10, min = 0, max = 3)
is_sig = pvalue < 0.01
pch = rep("*", 10)
pch[!is_sig] = NA
# color mapping for -log10(pvalue)

pvalue_col_fun = circlize::colorRamp2(c(0, 2, 3), c("green", "white", "red"))
ha = HeatmapAnnotation(
  pvalue = anno_simple(-log10(pvalue), col = pvalue_col_fun, pch = pch),
  annotation_name_side = "left")
ht = Heatmap(matrix(rnorm(100), 10), name = "mat", top_annotation = ha)
# now we generate two legends, one for the p-value

# see how we define the legend for pvalue

lgd_pvalue = Legend(title = "p-value", col = pvalue_col_fun, at = c(0, 1, 2, 3),
                    labels = c("1", "0.1", "0.01", "0.001"))
# and one for the significant p-values

lgd_sig = Legend(pch = "*", type = "points", labels = "< 0.01")
# these two self-defined legends are added to the plot by `annotation_legend_list`

draw(ht, annotation_legend_list = list(lgd_pvalue, lgd_sig))
2.3 Empty annotation
使用 anno_empty 获得空白注释,具体有什么用可以参考下面两个例子。
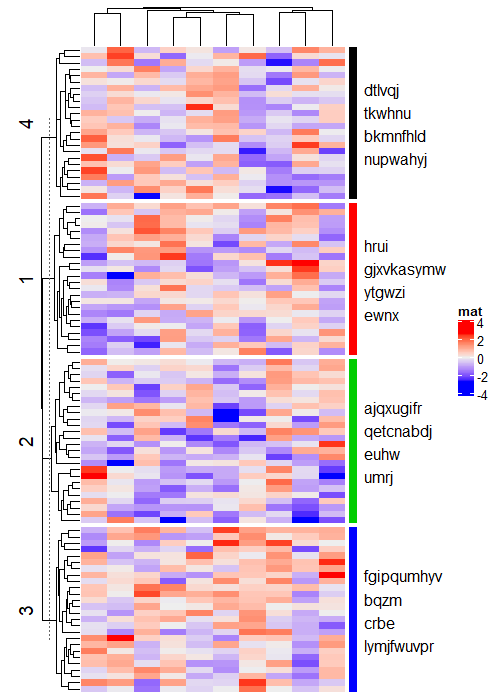
示例1:利用空白注释在右侧加上行名
random_text = function(n) {
  sapply(1:n, function(i) {
    paste0(sample(letters, sample(4:10, 1)), collapse = "")
  })
}
text_list = list(
  text1 = random_text(4),
  text2 = random_text(4),
  text3 = random_text(4),
  text4 = random_text(4)
)
# note how we set the width of this empty annotation

ha = rowAnnotation(foo = anno_empty(border = FALSE,
                                    width = max_text_width(unlist(text_list)) + unit(4, "mm")))
Heatmap(matrix(rnorm(1000), nrow = 100), name = "mat", row_km = 4, right_annotation = ha)
for(i in 1:4) {
  decorate_annotation("foo", slice = i, {
    grid.rect(x = 0, width = unit(2, "mm"), gp = gpar(fill = i, col = NA), just = "left")
    grid.text(paste(text_list[[i]], collapse = "\n"), x = unit(4, "mm"), just = "left")
  })
}
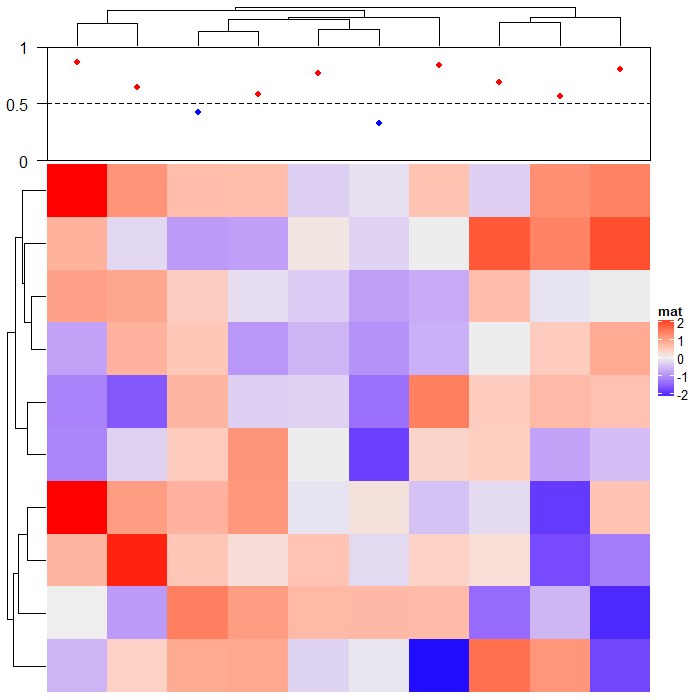
示例2:利用空白注释在上方添加画散点图的位置
ha = HeatmapAnnotation(foo = anno_empty(border = TRUE, height = unit(3, "cm")))
ht = Heatmap(matrix(rnorm(100), nrow = 10), name = "mat", top_annotation = ha)
ht = draw(ht)
co = column_order(ht)
value = runif(10)
decorate_annotation("foo", {
  # value on x-axis is always 1:ncol(mat)

  x = 1:10
  # while values on y-axis is the value after column reordering

  value = value[co]
  pushViewport(viewport(xscale = c(0.5, 10.5), yscale = c(0, 1)))
  grid.lines(c(0.5, 10.5), c(0.5, 0.5), gp = gpar(lty = 2),
             default.units = "native")
  grid.points(x, value, pch = 16, size = unit(2, "mm"),
              gp = gpar(col = ifelse(value > 0.5, "red", "blue")), default.units = "native")
  grid.yaxis(at = c(0, 0.5, 1))
  popViewport()
})
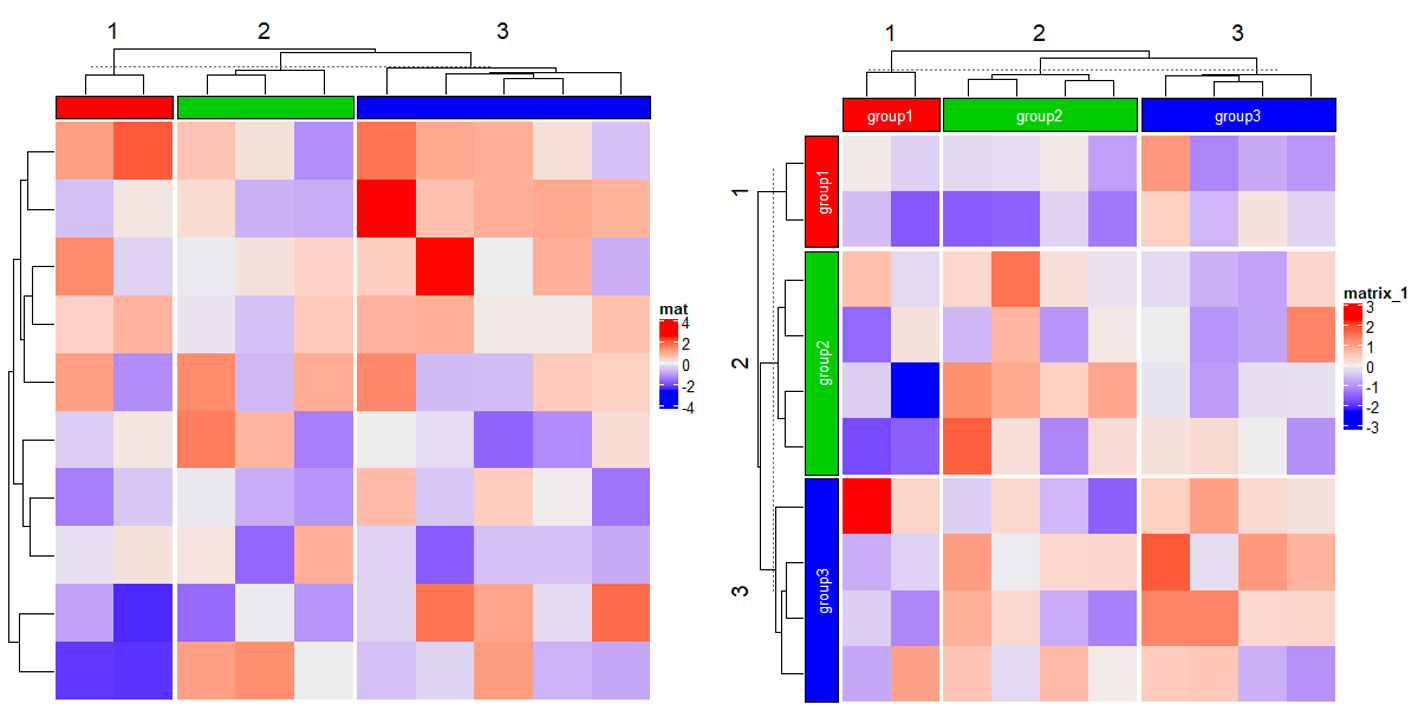
2.4 Block annotation
Heatmap(matrix(rnorm(100), 10), name = "mat",
        top_annotation = HeatmapAnnotation(foo = anno_block(gp = gpar(fill = 2:4))),
        column_km = 3)


Heatmap(matrix(rnorm(100), 10),
        top_annotation = HeatmapAnnotation(foo = anno_block(gp = gpar(fill = 2:4),
                                                            labels = c("group1", "group2", "group3"),
                                                            labels_gp = gpar(col = "white", fontsize = 10))),
        column_km = 3,
        left_annotation = rowAnnotation(foo = anno_block(gp = gpar(fill = 2:4),
                                                         labels = c("group1", "group2", "group3"),
                                                         labels_gp = gpar(col = "white", fontsize = 10))),
        row_km = 3)
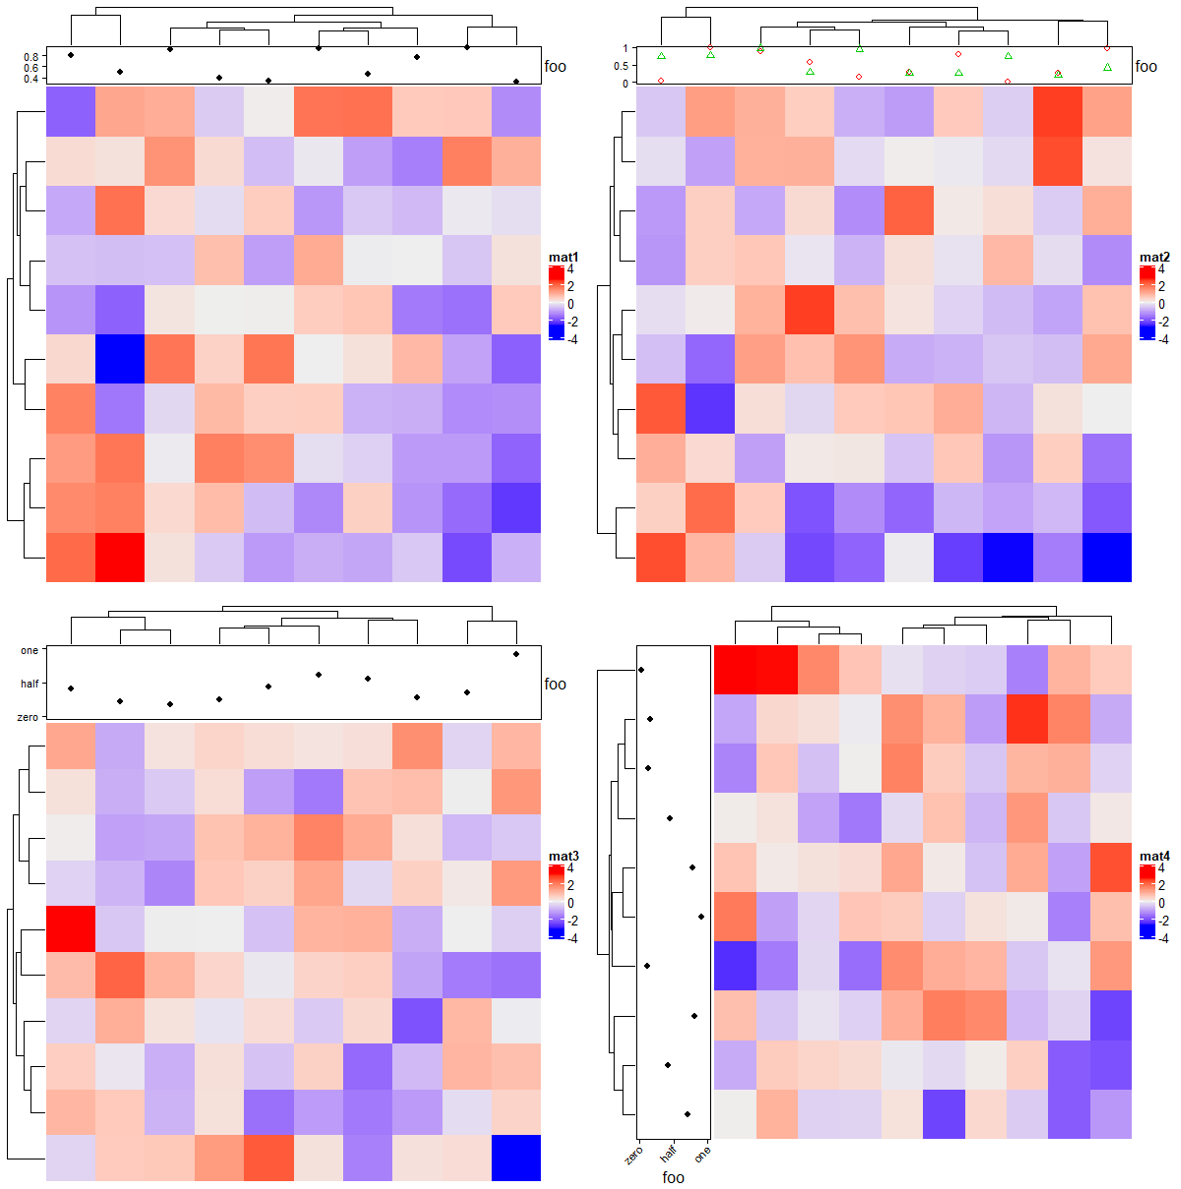
2.5 Points annotation
# 一组数值

Heatmap(matrix(rnorm(100), 10), name = "mat1",
        top_annotation = HeatmapAnnotation(foo = anno_points(runif(10))))
# 两组数值

Heatmap(matrix(rnorm(100), 10), name = "mat2",
        top_annotation = HeatmapAnnotation(foo = anno_points(matrix(runif(20), nc = 2),
                                                             pch = 1:2, gp = gpar(col = 2:3))))
# 点注释参数设置

Heatmap(matrix(rnorm(100), 10), name = "mat3",
        top_annotation = HeatmapAnnotation(foo = anno_points(runif(10),
                                                             ylim = c(0, 1), # y轴范围

                                                             height = unit(2, "cm"), # 高度

                                                             axis_param = list( # 坐标轴设置

                                                               side = "left", # 位置

                                                               at = c(0, 0.5, 1), # 刻度

                                                               labels = c("zero", "half", "one") # 标记

                                                             ))))
# 注意是行注释和列注释的参数区别

Heatmap(matrix(rnorm(100), 10), name = "mat4",
        left_annotation = rowAnnotation(foo = anno_points(runif(10),
                                                          ylim = c(0, 1),
                                                          width = unit(2, "cm"), # 宽度

                                                          axis_param = list(
                                                            side = "bottom",
                                                            at = c(0, 0.5, 1),
                                                            labels = c("zero", "half", "one"),
                                                            labels_rot = 45 # 标记旋转角度

                                                          ))))
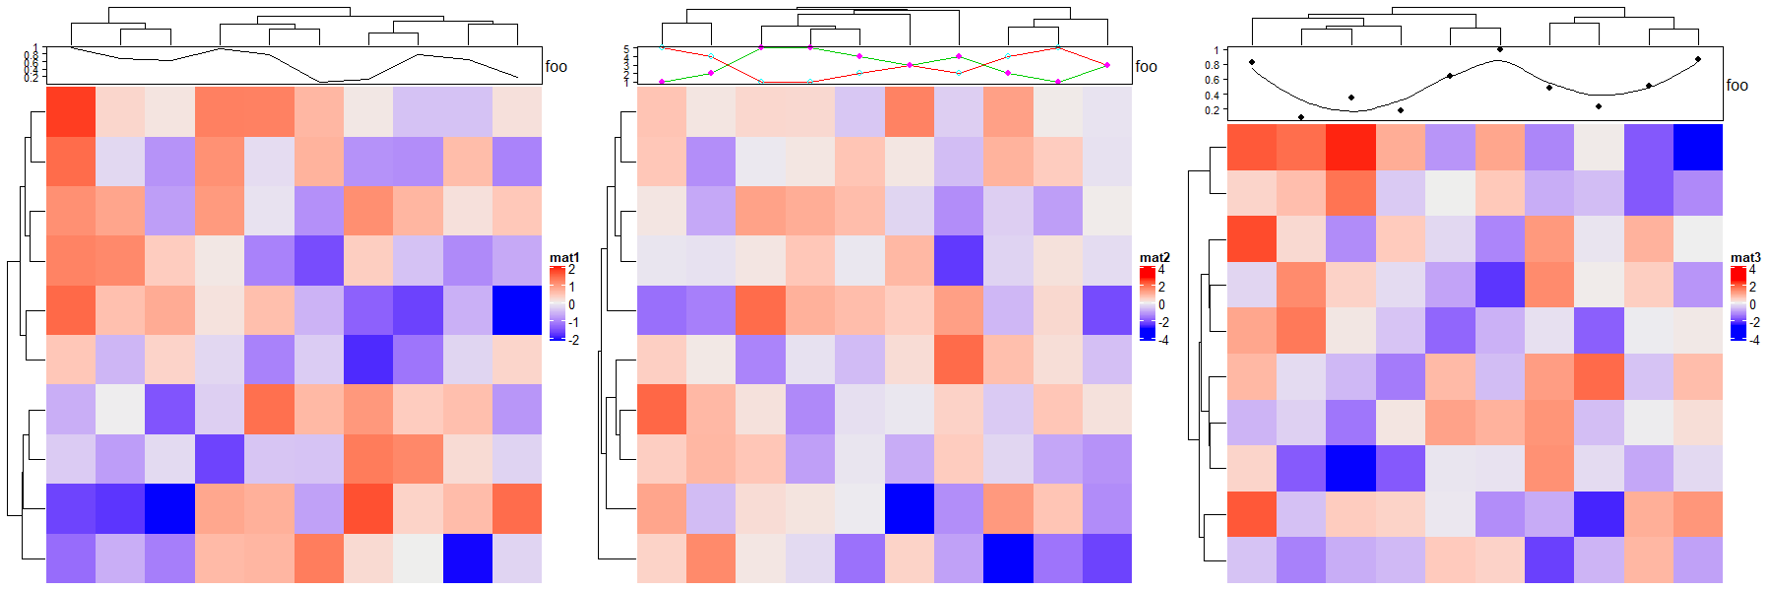
2.6 Lines annotation
# 一组数值

Heatmap(matrix(rnorm(100), 10), name = "mat1",
        top_annotation = HeatmapAnnotation(foo = anno_lines(runif(10))))
# 两组数值

Heatmap(matrix(rnorm(100), 10), name = "mat2",
        top_annotation = HeatmapAnnotation(foo = anno_lines(cbind(c(1:5, 1:5), c(5:1, 5:1)),
                                                            gp = gpar(col = 2:3), add_points = TRUE,
                                                            pt_gp = gpar(col = 5:6), pch = c(1, 16))))
# 平滑曲线

Heatmap(matrix(rnorm(100), 10), name = "mat3",
        top_annotation = HeatmapAnnotation(foo = anno_lines(runif(10),
                                                            smooth = TRUE, # 平滑曲线

                                                            height = unit(2, "cm")))) #高度
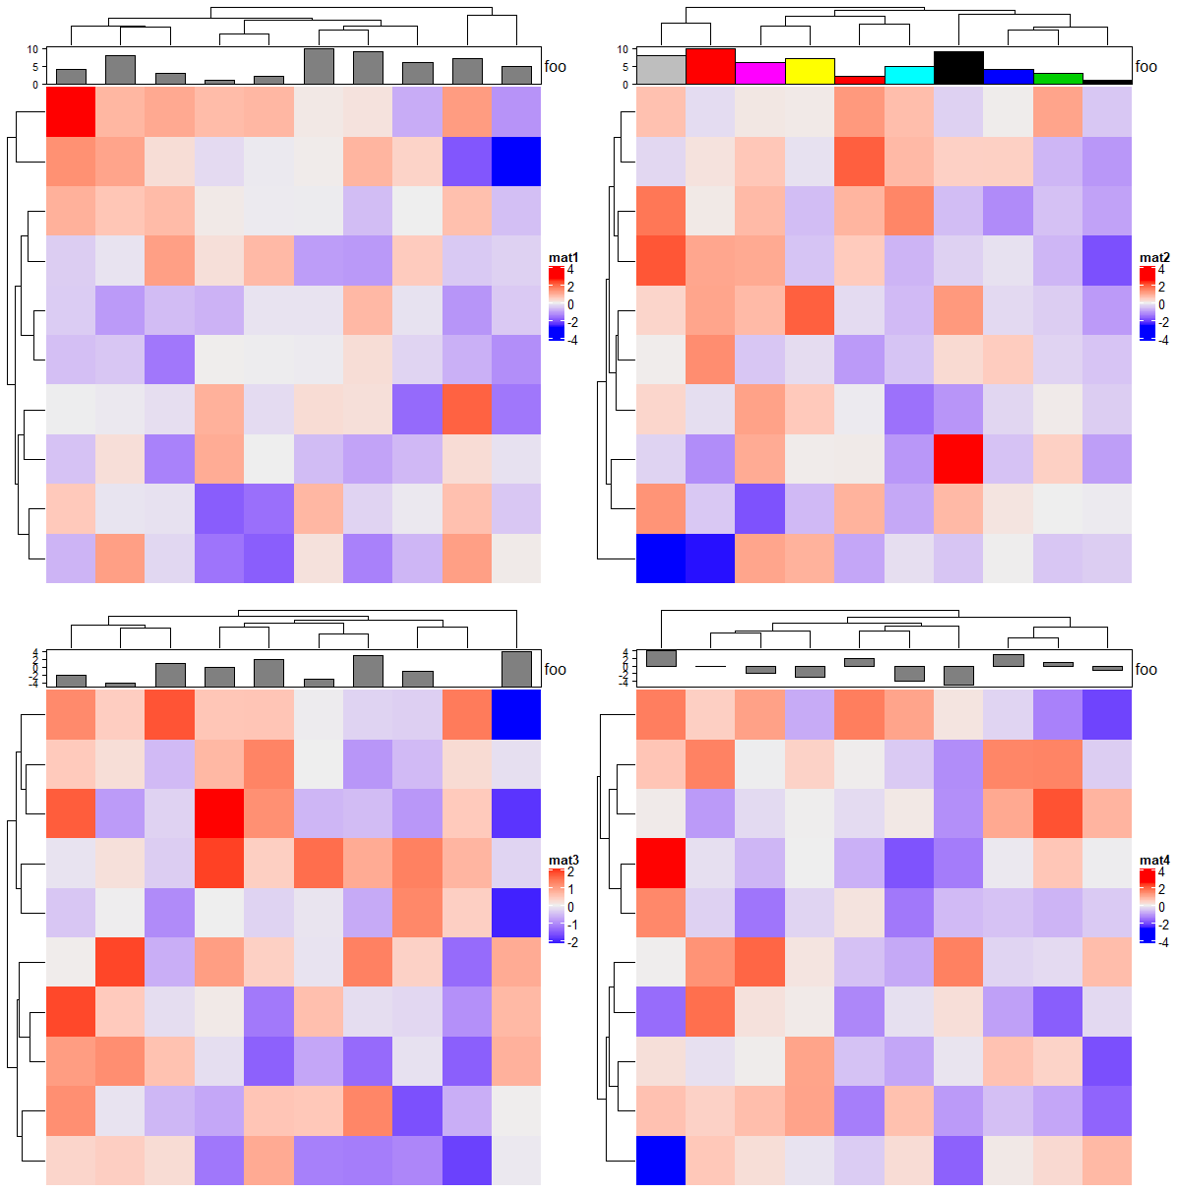
2.7 Barplot annotation
# 默认

Heatmap(matrix(rnorm(100), 10), name = "mat1",
        top_annotation = HeatmapAnnotation(foo = anno_barplot(1:10)))

Heatmap(matrix(rnorm(100), 10), name = "mat2",
        top_annotation = HeatmapAnnotation(foo = anno_barplot(1:10, bar_width = 1, # 柱宽(0-1)

                                                              gp = gpar(fill = 1:10)))) # 填充色


# 设置基线  "min" "max" or a numeric value

Heatmap(matrix(rnorm(100), 10), name = "mat3",
        top_annotation = HeatmapAnnotation(foo = anno_barplot(seq(-5, 4), baseline = "min")))
Heatmap(matrix(rnorm(100), 10), name = "mat4",
        top_annotation = HeatmapAnnotation(foo = anno_barplot(seq(-5, 4), baseline = 0)))
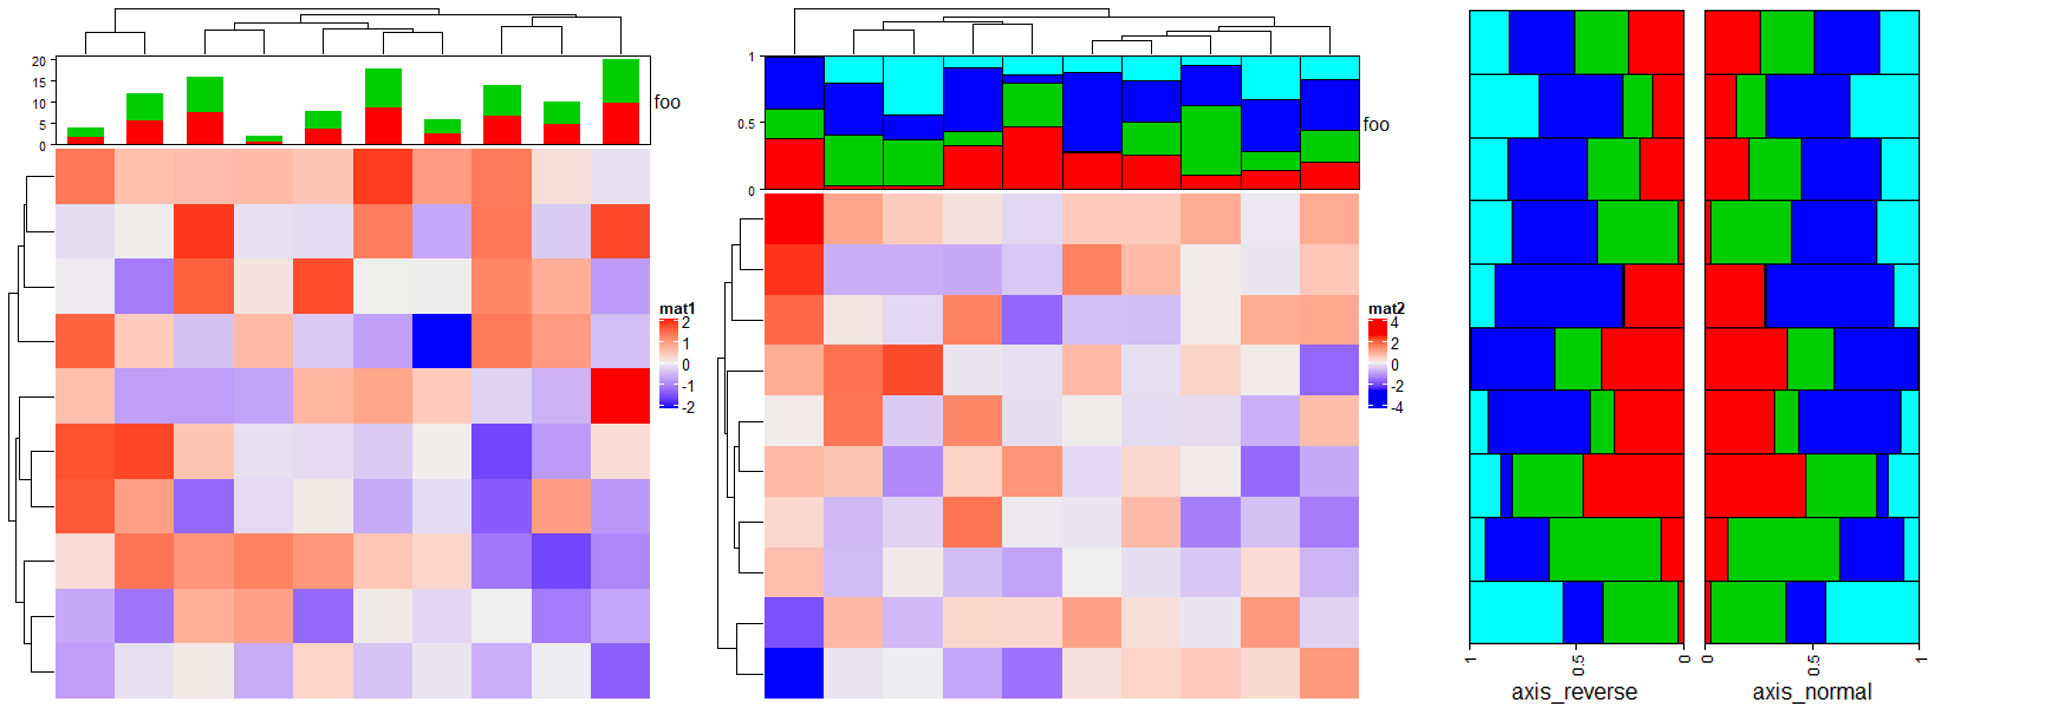
# 堆积图

Heatmap(matrix(rnorm(100), 10), name = "mat1",
        top_annotation = HeatmapAnnotation(foo = anno_barplot(cbind(1:10, 1:10),
                                                              gp = gpar(fill = 2:3, col = 2:3),
                                                              height = unit(2, "cm")))) # 高度

# 百分比堆积图

m = matrix(runif(4*10), nc = 4)
m = t(apply(m, 1, function(x) x/sum(x)))
Heatmap(matrix(rnorm(100), 10), name = "mat2",
        top_annotation = HeatmapAnnotation(foo = anno_barplot(m, gp = gpar(fill = 2:5),
                                                              bar_width = 1,
                                                              height = unit(3, "cm"))))

# 翻转  reverse

ha_list = rowAnnotation(axis_reverse = anno_barplot(m, gp = gpar(fill = 2:5),
                                                    axis_param = list(direction = "reverse"),
                                                    bar_width = 1, width = unit(4, "cm"))) +
  rowAnnotation(axis_normal = anno_barplot(m, gp = gpar(fill = 2:5),
                                           bar_width = 1, width = unit(4, "cm")))
draw(ha_list, ht_gap = unit(4, "mm")) # 注释间距离
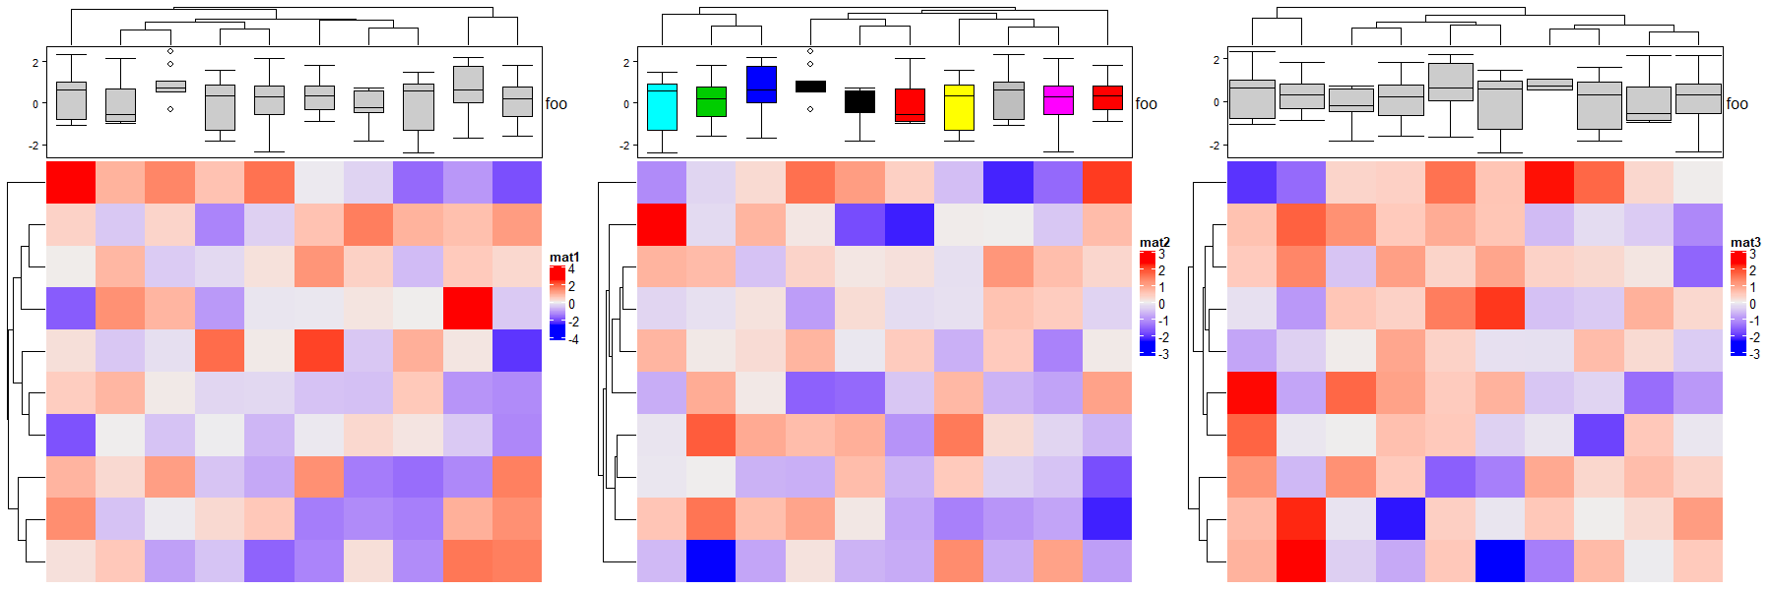
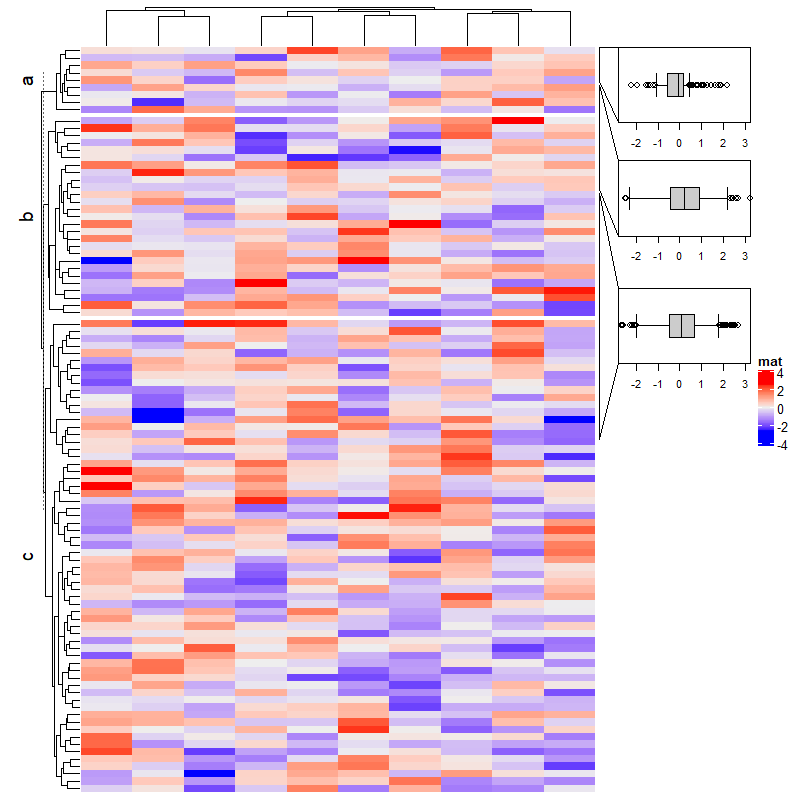
2.8 Boxplot annotation
set.seed(12345)
m = matrix(rnorm(100), 10)

ha = HeatmapAnnotation(foo = anno_boxplot(m, height = unit(3, "cm"))) # 高度

Heatmap(matrix(rnorm(100), 10), name = "mat1",top_annotation = ha)

ha = HeatmapAnnotation(foo = anno_boxplot(m, height = unit(3, "cm"), gp = gpar(fill = 1:10))) # 填充色

Heatmap(matrix(rnorm(100), 10), name = "mat2",top_annotation = ha)

ha = HeatmapAnnotation(foo = anno_boxplot(m, height = unit(3, "cm"),
                                          box_width = 0.9, # 箱体宽度

                                          outline = FALSE)) # 去除异常值

Heatmap(matrix(rnorm(100), 10), name = "mat3",top_annotation = ha)
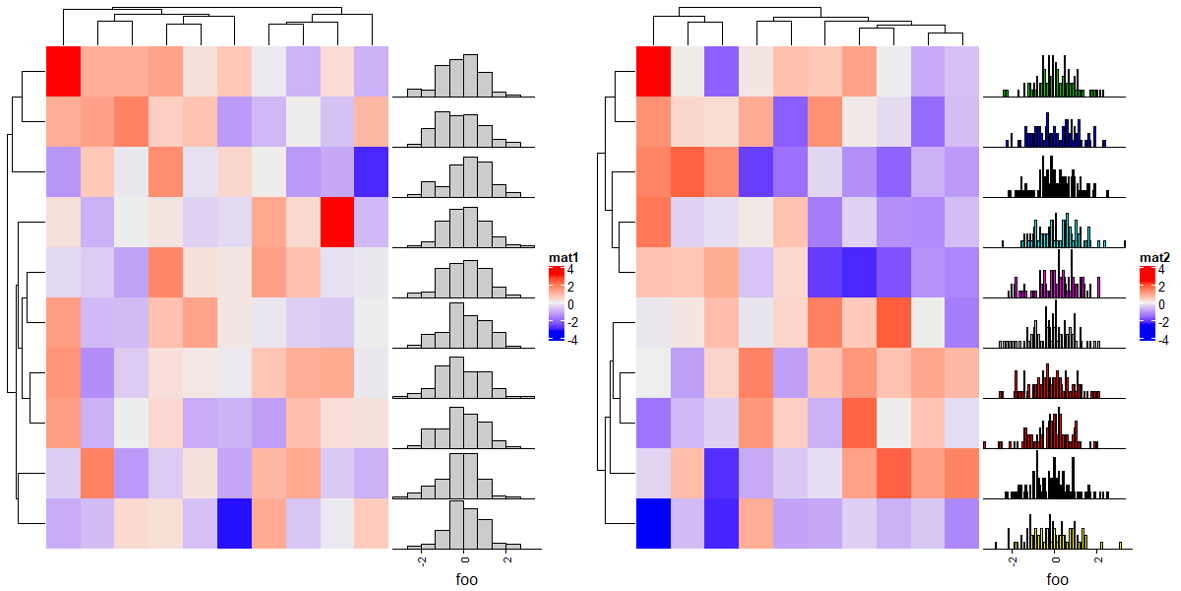
2.9 Histogram annotation
m = matrix(rnorm(1000), nc = 100)
ha = rowAnnotation(foo = anno_histogram(m)) # apply `m` on rows

Heatmap(matrix(rnorm(100), 10), name = "mat1",right_annotation = ha)

ha = rowAnnotation(foo = anno_histogram(m, n_breaks = 100, # 设置刻度大小

                                        gp = gpar(fill = 1:10))) # 设置填充色

Heatmap(matrix(rnorm(100), 10), name = "mat2",right_annotation = ha)
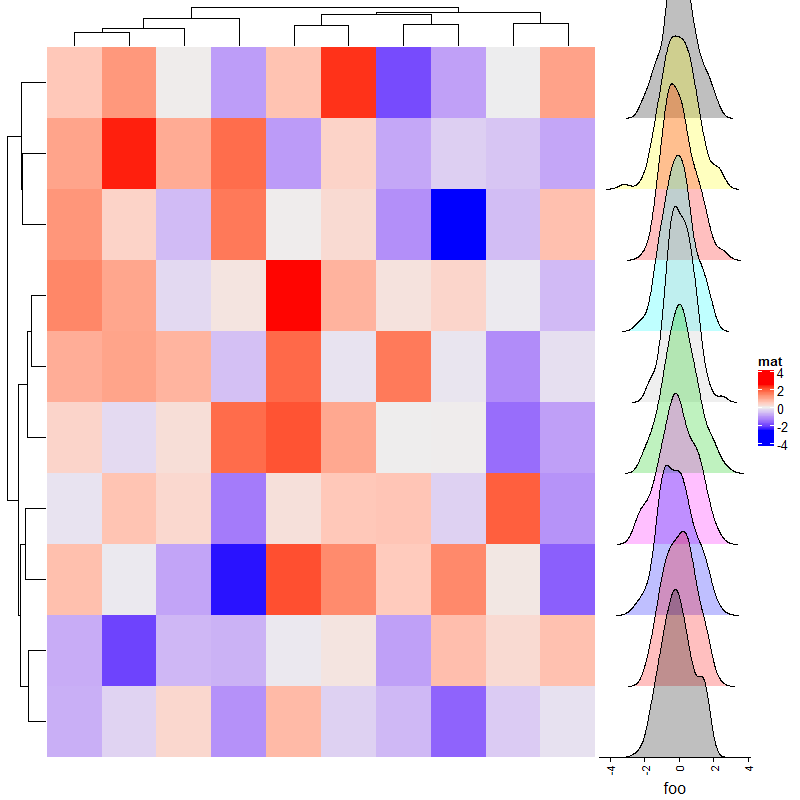
2.10 Density annotation
ha = rowAnnotation(foo = anno_density(m))
Heatmap(matrix(rnorm(100), 10), name = "mat1",right_annotation = ha)

# Joyplot

ha = rowAnnotation(foo = anno_density(m, joyplot_scale = 2,
                                      gp = gpar(fill = "#e41a1c60"), # 使用带有透明度的颜色填充

                                      border = FALSE)) # 去除边框

Heatmap(matrix(rnorm(100), 10), name = "mat2",right_annotation = ha)

# type:"violine" for violin plot

ha = rowAnnotation(foo = anno_density(m, type = "violin",
                                      gp = gpar(fill = 1:10)))
Heatmap(matrix(rnorm(100), 10), name = "mat3",right_annotation = ha)

# type:"heatmap" for heatmap visualization of density distribution

m2 = matrix(rnorm(50*10), nrow = 10)
ha = rowAnnotation(foo = anno_density(m2, type = "heatmap",
                                      width = unit(6, "cm"))) # 宽度

Heatmap(matrix(rnorm(100), 10), name = "mat4",right_annotation = ha)


ha = rowAnnotation(foo = anno_density(m2, type = "heatmap", width = unit(6, "cm"),
                                      heatmap_colors = c("white", "orange"))) # 热图颜色

Heatmap(matrix(rnorm(100), 10), name = "mat5",right_annotation = ha)

2.11 Joyplot annotation
m = matrix(rnorm(1000), nc = 10)
lt = apply(m, 2, function(x) data.frame(density(x)[c("x", "y")]))
ha = rowAnnotation(foo = anno_joyplot(lt, width = unit(4, "cm"), # 宽度

                                      gp = gpar(fill = 1:10), # 填充色

                                      transparency = 0.75, # 透明度

                                      scale = 3)) # 相对高度,1为界限

Heatmap(matrix(rnorm(100), 10), name = "mat",right_annotation = ha)
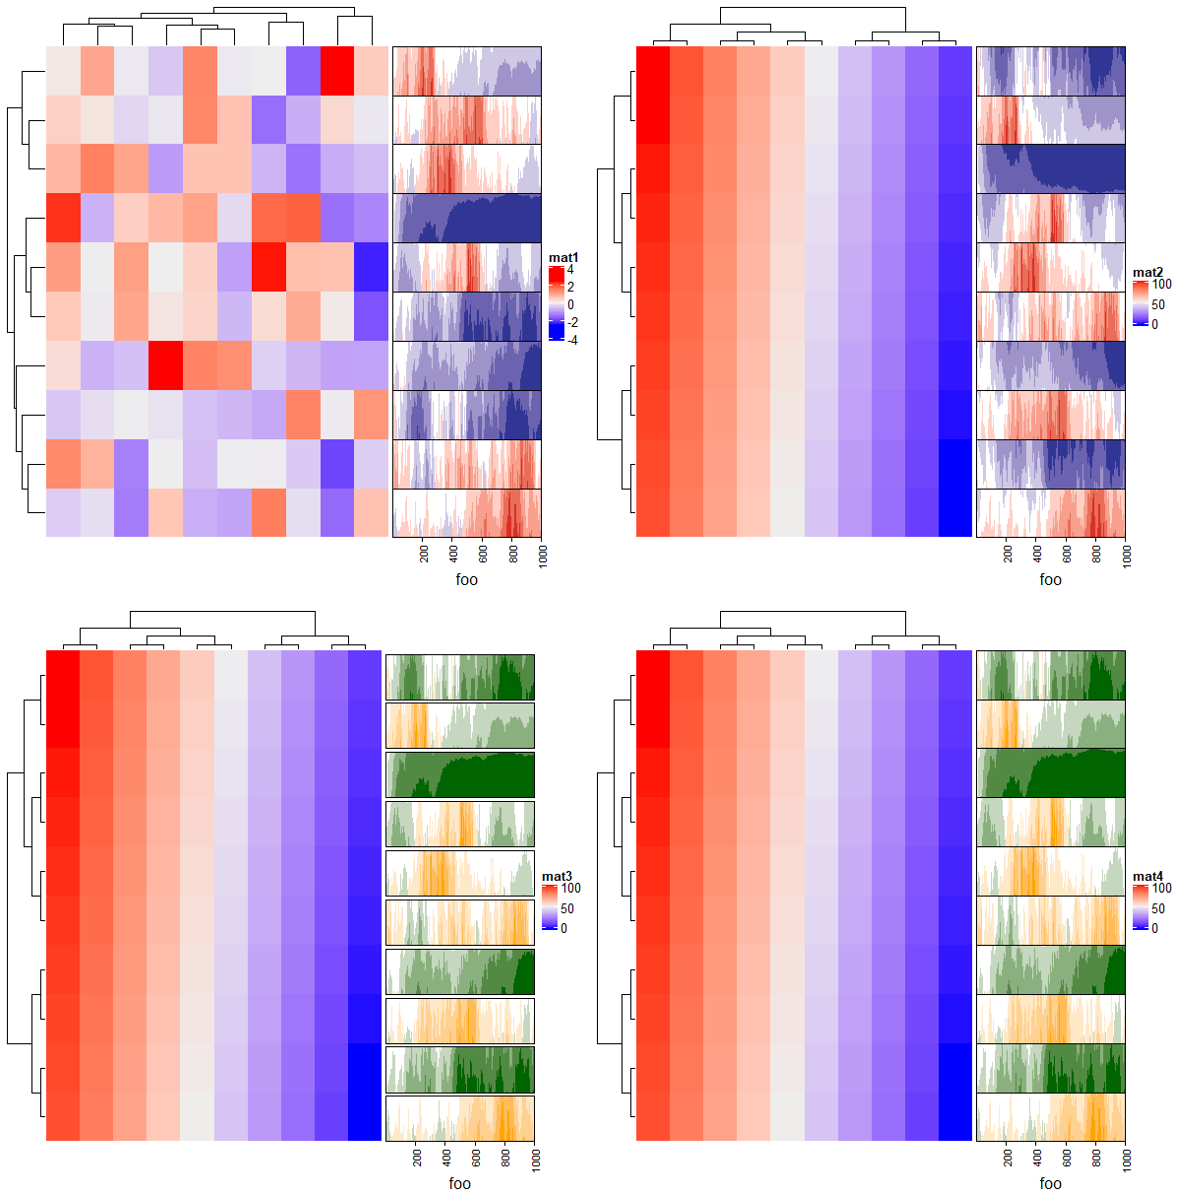
2.12 Horizon chart annotation
# 一个list

lt = lapply(1:10, function(x) cumprod(1 + runif(1000, -x/100, x/100)) - 1)
# 默认效果

ha = rowAnnotation(foo = anno_horizon(lt))
Heatmap(matrix(rnorm(100), 10), name = "mat1",right_annotation = ha)

# 负值翻转 negative_from_top

ha = rowAnnotation(foo = anno_horizon(lt, negative_from_top = TRUE))
Heatmap(matrix(1:100, 10), name = "mat2",right_annotation = ha)

# 颜色及间隔

ha = rowAnnotation(foo = anno_horizon(lt,gp = gpar(pos_fill = "orange", # 负值填充色

                                                   neg_fill = "darkgreen"), # 正值填充色

                                      gap = unit(1, "mm"))) # 间隔

Heatmap(matrix(1:100, 10), name = "mat3",right_annotation = ha)

# 也可以填充颜色的向量

ha = rowAnnotation(foo = anno_horizon(lt, gp = gpar(pos_fill = rep(c("orange", "red"), each = 10),
                                                    neg_fill = rep(c("darkgreen", "blue"), each = 10))))
Heatmap(matrix(1:100, 10), name = "mat4",right_annotation = ha)
2.13 Text annotation
ha = rowAnnotation(foo = anno_text(month.name[1:10],
                                   gp = gpar(fontsize = 1:12+4), # 大小

                                   rot = 30, # 角度

                                   location = 0, # 位置

                                   just = "left")) # 对齐方式("left", "right", "centre", "center", "bottom", and "top" )

Heatmap(matrix(1:100, 10), name = "mat1",right_annotation = ha)

ha = rowAnnotation(foo = anno_text(month.name[1:10], location = 0.5, just = "center",
                                   gp = gpar(fill = 1:10, # 背景填充色

                                             col = "white", # 文字颜色

                                             border = "black"), # 边框颜色

                                   width = max_text_width(month.name)*1.2)) # 宽度

Heatmap(matrix(1:100, 10), name = "mat2",right_annotation = ha)
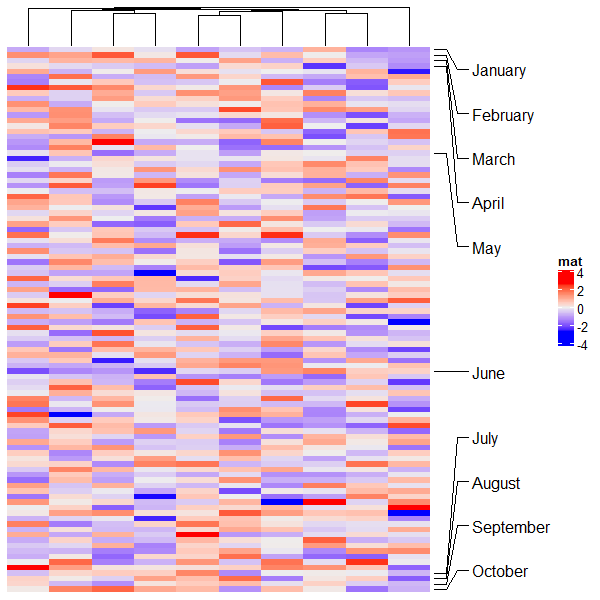
2.14 Mark annotation
m = matrix(rnorm(1000), nrow = 100)
ha = rowAnnotation(foo = anno_mark(at = c(1:4, 20, 60, 97:100),
                                   labels = month.name[1:10],
                                   link_width = unit(10, "mm"), #线长度

                                   padding = unit(5, "mm"), # 标签间隔

                                   extend = unit(0, "mm")))
Heatmap(m, name = "mat", cluster_rows = FALSE, right_annotation = ha)
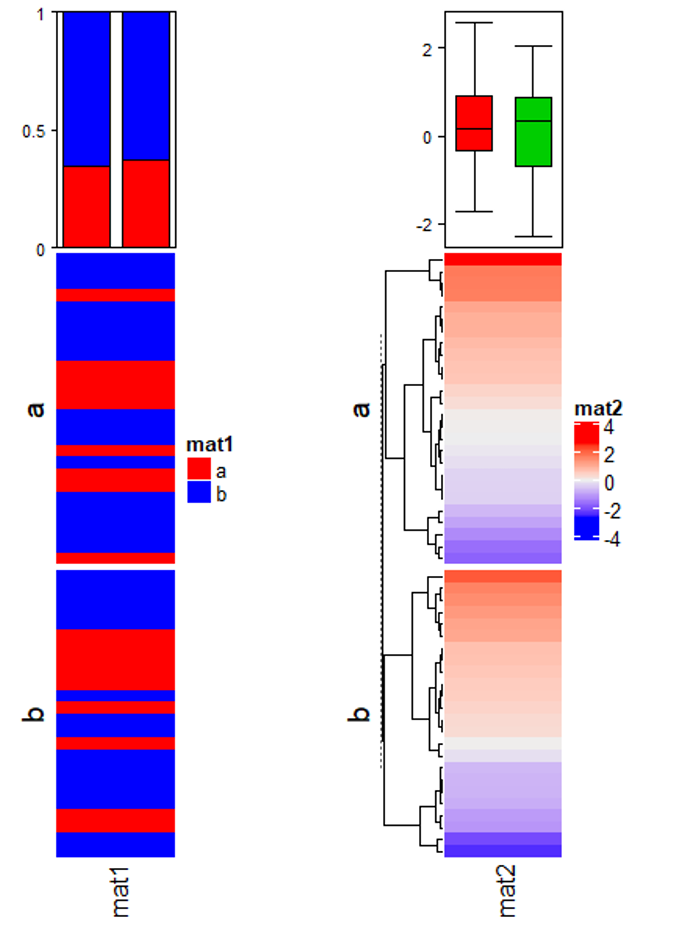
2.15 Summary annotation
统计划分后的每个区块的相关信息。
# 条形图

ha = HeatmapAnnotation(summary = anno_summary(height = unit(4, "cm")))
v = sample(letters[1:2], 50, replace = TRUE)
split = sample(letters[1:2], 50, replace = TRUE)

Heatmap(v, name = "mat1", col = c("a" = "red", "b" = "blue"),
        top_annotation = ha, width = unit(2, "cm"), row_split = split)

# 箱线图

ha = HeatmapAnnotation(summary = anno_summary(gp = gpar(fill = 2:3),
                                              height = unit(4, "cm")))
v = rnorm(50)
Heatmap(v, name = "mat2", top_annotation = ha, width = unit(2, "cm"),
        row_split = split)
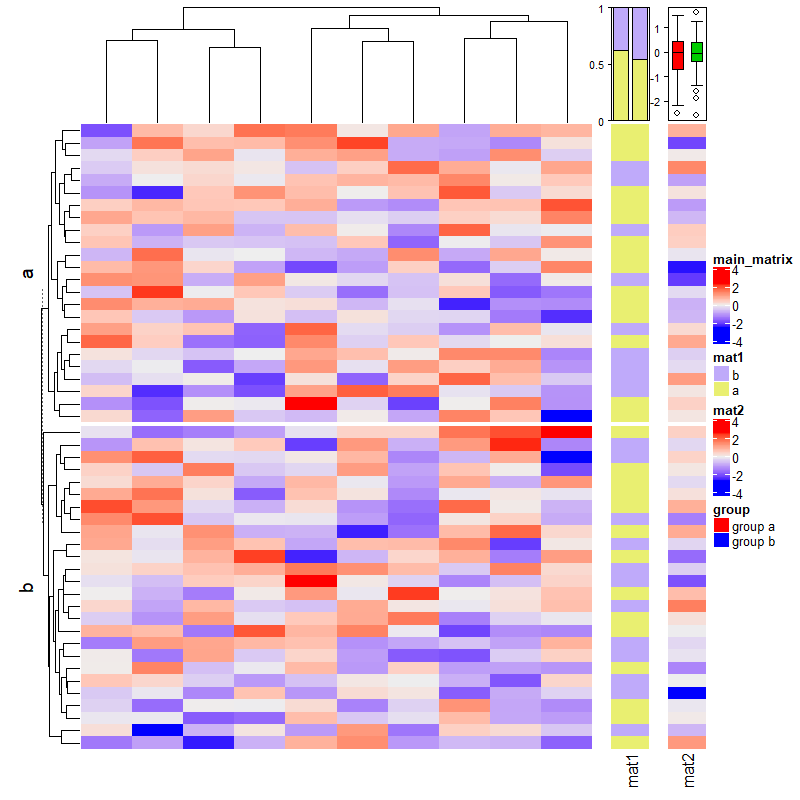
m = matrix(rnorm(50*10), nrow = 50)
ht_list = Heatmap(m, name = "main_matrix")

ha = HeatmapAnnotation(summary = anno_summary(height = unit(3, "cm")))
v = sample(letters[1:2], 50, replace = TRUE)
ht_list = ht_list + Heatmap(v, name = "mat1", top_annotation = ha, width = unit(1, "cm"))

ha = HeatmapAnnotation(summary = anno_summary(gp = gpar(fill = 2:3),
                                              height = unit(3, "cm")))
v = rnorm(50)
ht_list = ht_list + Heatmap(v, name = "mat2", top_annotation = ha, width = unit(1, "cm"))

split = sample(letters[1:2], 50, replace = TRUE)
lgd_boxplot = Legend(labels = c("group a", "group b"), title = "group",
                     legend_gp = gpar(fill = c("red", "blue")))
draw(ht_list, row_split = split, ht_gap = unit(5, "mm"),
     heatmap_legend_list = list(lgd_boxplot))
2.16 Zoom annotation
set.seed(123)
m = matrix(rnorm(100*10), nrow = 100)
subgroup = sample(letters[1:3], 100, replace = TRUE, prob = c(1, 5, 10))
rg = range(m)
panel_fun = function(index, nm) {
  pushViewport(viewport(xscale = rg, yscale = c(0, 2)))
  grid.rect()
  grid.xaxis(gp = gpar(fontsize = 8))
  grid.boxplot(m[index, ], pos = 1, direction = "horizontal")
  popViewport()
}
anno = anno_zoom(align_to = subgroup, # 用哪些画图

                 which = "row",
                 panel_fun = panel_fun, # 怎么画图

                 size = unit(2, "cm"),
                 gap = unit(1, "cm"),
                 width = unit(4, "cm"))
Heatmap(m, name = "mat", right_annotation = rowAnnotation(foo = anno), row_split = subgroup)
2.17 Multiple annotations
set.seed(123)
mat = matrix(rnorm(100), 10)

ha = HeatmapAnnotation(foo = 1:10,
                       bar = cbind(1:10, 10:1),
                       pt = anno_points(1:10),
                       # show_legend = c(bar = FALSE),

                       show_legend = c(T,F), # 是否显示图例

                       show_annotation_name = c(T,T,F), # 是否显示注释名

                       border = c(F,T) ,# 是否显示边框

                       gap = unit(c(2,4), "mm")
                       )
Heatmap(mat, name = "mat1", top_annotation = ha)

ha = HeatmapAnnotation(foo = 1:10,
                       bar = cbind(1:10, 10:1),
                       pt = anno_points(1:10),
                       gp = gpar(col = "red") # 线条或边框的颜色

)
Heatmap(mat, name = "mat2", top_annotation = ha)
2.18 Size of annotations
ha = HeatmapAnnotation(foo = cbind(1:10, 10:1),
                       bar = 1:10,
                       pt = anno_points(1:10))
Heatmap(mat, name = "mat1", top_annotation = ha)

# annotation_height 直接添加长度单位

ha = HeatmapAnnotation(foo = cbind(1:10, 10:1),
                       bar = 1:10,
                       pt = anno_points(1:10),
                       annotation_height = unit(1:3, "cm"))
Heatmap(mat, name = "mat2", top_annotation = ha)
height:确定总的注释高度annotation_height:确定每个注释比例。
# foo: 2cm, bar: 4cm, pt: 6cm

ha = HeatmapAnnotation(foo = cbind(1:10, 10:1),
                       bar = 1:10,
                       pt = anno_points(1:10),
                       annotation_height = 1:3, height = unit(12, "cm"))
Heatmap(mat, name = "mat1", top_annotation = ha)


# foo: 1.5cm, bar: 1.5cm, pt: 3cm

ha = HeatmapAnnotation(foo = cbind(1:10, 10:1),
                       bar = 1:10,
                       pt = anno_points(1:10),
                       annotation_height = unit(c(1, 1, 3), c("null", "null", "cm")), height = unit(6, "cm"))
Heatmap(mat, name = "mat2", top_annotation = ha)


# foo: 2cm, bar: 1cm, pt: 3cm

ha = HeatmapAnnotation(foo = cbind(1:10, 10:1),
                       bar = 1:10,
                       pt = anno_points(1:10),
                       annotation_height = unit(c(2, 1, 3), c("cm", "null", "cm")), height = unit(6, "cm"))
Heatmap(mat, name = "mat3", top_annotation = ha)
2.19 Utility functions
这里主要介绍一些比较实用的小功能。
ha = HeatmapAnnotation(foo = 1:10,
                       bar = cbind(1:10, 10:1),
                       pt = anno_points(1:10))
length(ha) # 注释个数

nobs(ha) #行数

names(ha) # 注释名


names(ha) = c("FOO", "BAR", "PT") # 重命名注释名

names(ha)
多个注释也是一样的。
ha1 = HeatmapAnnotation(foo = 1:10,
                        bar = cbind(1:10, 10:1),
                        pt = anno_points(1:10))
ha2 = HeatmapAnnotation(FOO = runif(10),
                        BAR = sample(c("a", "b"), 10, replace = TRUE),
                        PT = anno_points(rnorm(10)))
ha = c(ha1, ha2)
names(ha)
2.20 Implement new annotation functions
自定义注释。
x = 1:10
anno1 = AnnotationFunction(
  fun = function(index, k, n) {
    n = length(index)
    pushViewport(viewport(xscale = c(0.5, n + 0.5), yscale = c(0, 10)))
    grid.rect()
    grid.points(1:n, x[index], default.units = "native")
    if(k == 1) grid.yaxis()
    popViewport()
  },
  var_import = list(x = x),
  n = 10,
  subsetable = TRUE,
  height = unit(2, "cm")
)
anno1

m = rbind(1:10, 11:20)
Heatmap(m, top_annotation = HeatmapAnnotation(foo = anno1))
Heatmap(m, top_annotation = HeatmapAnnotation(foo = anno1),
        column_split = rep(c("A", "B"), each = 5))
3 A List of Heatmaps
本节主要就是介绍怎么样组合多个热图。老样子先构建矩阵。
set.seed(123)
mat1 = matrix(rnorm(80, 2), 8, 10)
mat1 = rbind(mat1, matrix(rnorm(40, -2), 4, 10))
rownames(mat1) = paste0("R", 1:12)
colnames(mat1) = paste0("C", 1:10)

mat2 = matrix(runif(60, max = 3, min = 1), 6, 10)
mat2 = rbind(mat2, matrix(runif(60, max = 2, min = 0), 6, 10))
rownames(mat2) = paste0("R", 1:12)
colnames(mat2) = paste0("C", 1:10)

le = sample(letters[1:3], 12, replace = TRUE)
names(le) = paste0("R", 1:12)

ind = sample(12, 12)
mat1 = mat1[ind, ]
mat2 = mat2[ind, ]
le = le[ind]
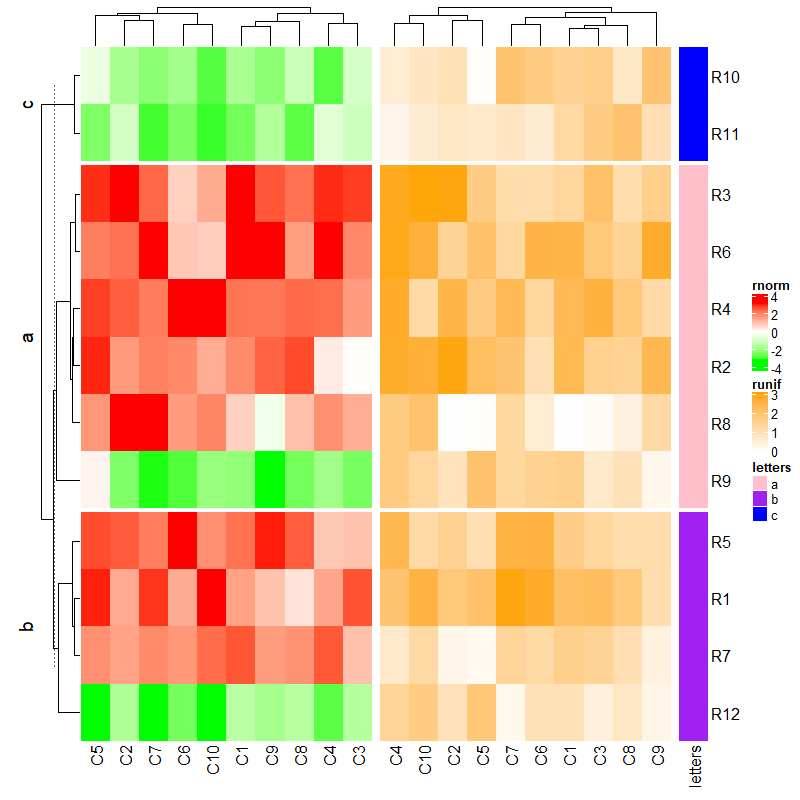
上面构建了mat1, mat2 和 le 三个矩阵,最简单粗暴的组合方式就是利用 + 来完成热图之间的组合,可以自己先运行下面的代码简单感受一下花式组合,后面再继续介绍相关参数的设置。
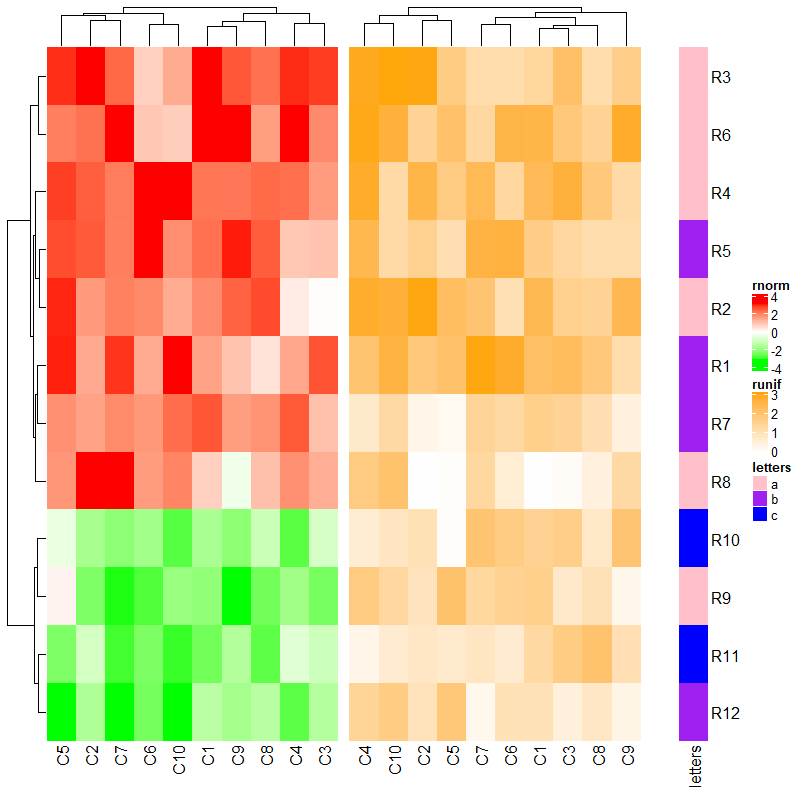
ht1 = Heatmap(mat1, name = "rnorm")
ht2 = Heatmap(mat2, name = "runif")
ht3 = Heatmap(le, name = "letters")

ht1 + ht2 + ht3
ht_list = ht1 + ht2 + ht3
ht1 + ht_list
ht_list + ht1
ht_list + ht_list
在介绍单个热图制作的时候,提到过循环出图的问题。现在了解了组合,我们可以先用一个 list 来存储热图。
ht_list = NULL  ## Heatmap(...) + NULL gives you a HeatmapList object

for(s in sth) {
  ht_list = ht_list + Heatmap(...)
}
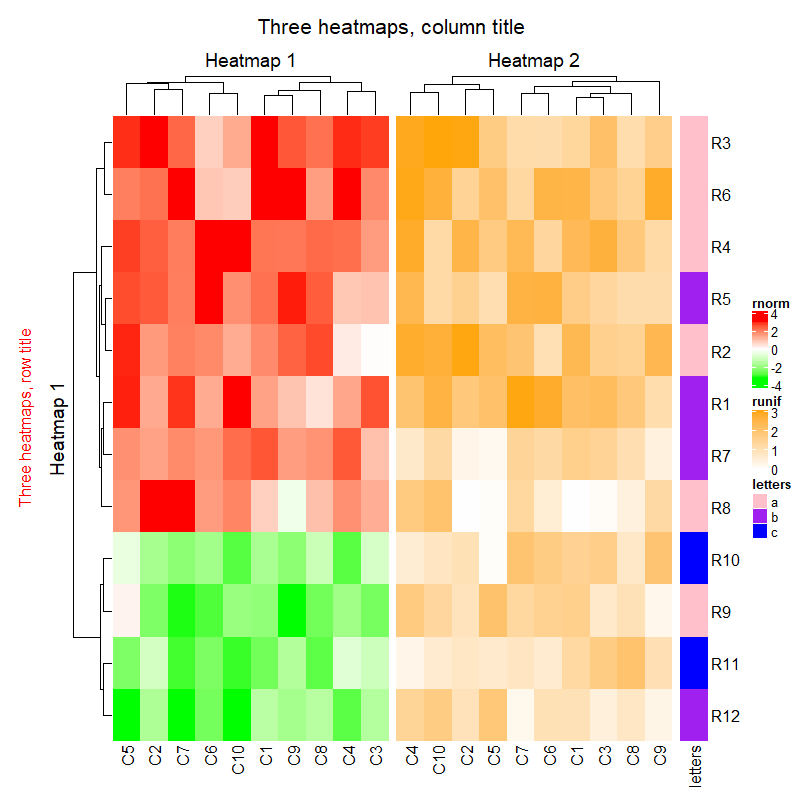
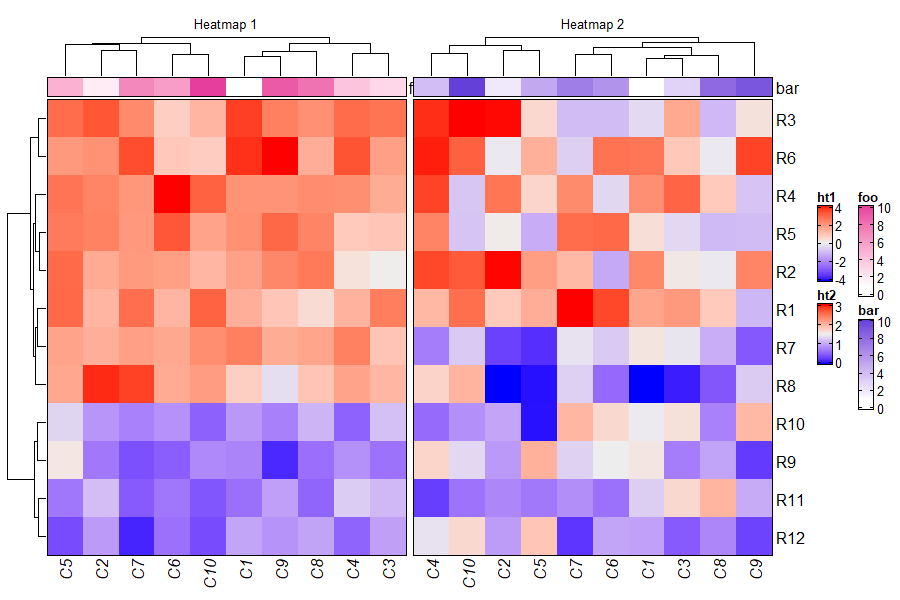
3.1 Titles
col_rnorm = circlize::colorRamp2(c(-3, 0, 3), c("green", "white", "red"))
col_runif = circlize::colorRamp2(c(0, 3), c("white", "orange"))
col_letters = c("a" = "pink", "b" = "purple", "c" = "blue")

ht1 = Heatmap(mat1, name = "rnorm", col = col_rnorm,
              row_title = "Heatmap 1", column_title = "Heatmap 1")
ht2 = Heatmap(mat2, name = "runif", col = col_runif,
              row_title = "Heatmap 2", column_title = "Heatmap 2")
ht3 = Heatmap(le, name = "letters", col = col_letters)
ht_list = ht1 + ht2 + ht3

draw(ht_list,
     row_title = "Three heatmaps, row title", # 行标题

     row_title_gp = gpar(col = "red"), # 行标题名参数

     column_title = "Three heatmaps, column title", # 列标题

     column_title_gp = gpar(fontsize = 16)) # 列标题参数
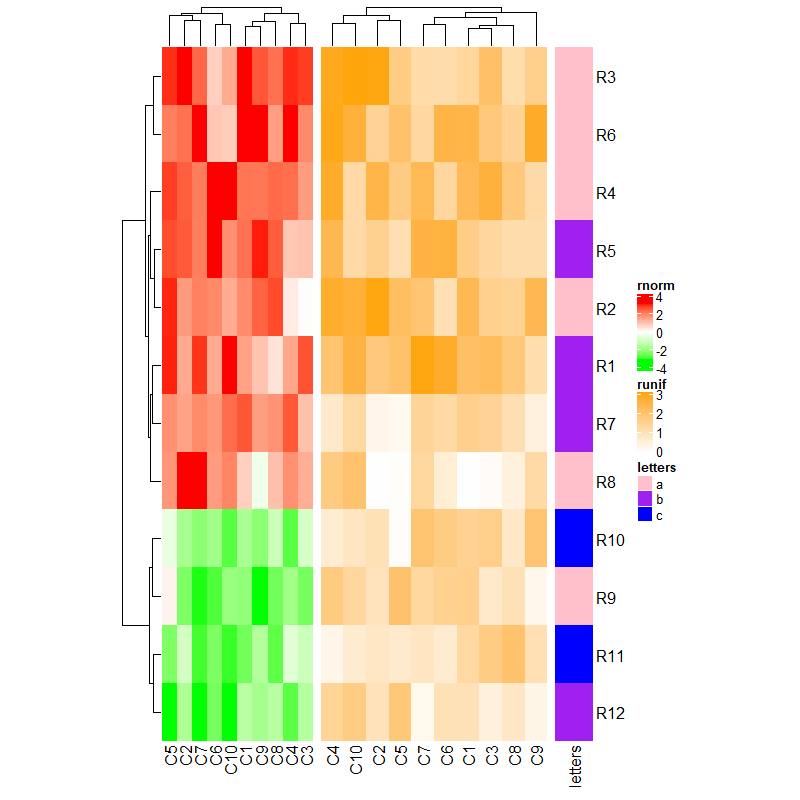
3.2 Size of heatmaps
参数后传入长度。
ht1 = Heatmap(mat1, name = "rnorm", col = col_rnorm, width = unit(4, "cm"))
ht2 = Heatmap(mat2, name = "runif", col = col_runif, width = unit(6, "cm"))
ht3 = Heatmap(le, name = "letters", col = col_letters, width = unit(1, "cm"))
ht1 + ht2 + ht3
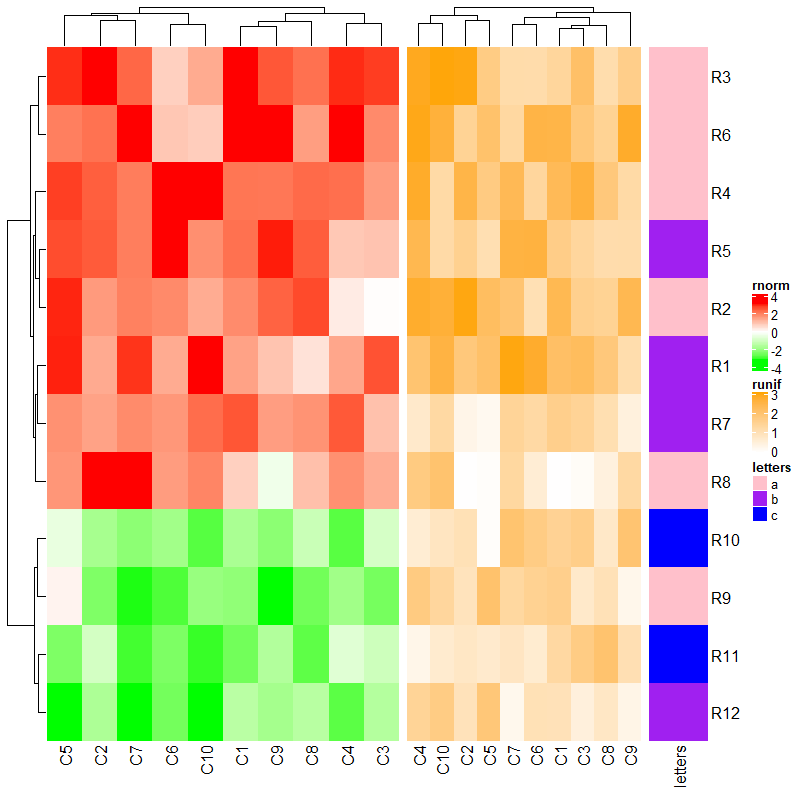
参数后传入比例,如下直接填入数字即可。
ht1 = Heatmap(mat1, name = "rnorm", col = col_rnorm, width = 6)
ht2 = Heatmap(mat2, name = "runif", col = col_runif, width = 4)
ht3 = Heatmap(le, name = "letters", col = col_letters, width = 1)
ht1 + ht2 + ht3
3.3 Gap between heatmaps
ht1 = Heatmap(mat1, name = "rnorm", col = col_rnorm)
ht2 = Heatmap(mat2, name = "runif", col = col_runif)
ht3 = Heatmap(le, name = "letters", col = col_letters)
ht_list = ht1 + ht2 + ht3
draw(ht_list, ht_gap = unit(3, "mm"))
draw(ht_list, ht_gap = unit(c(3, 10), "mm"))
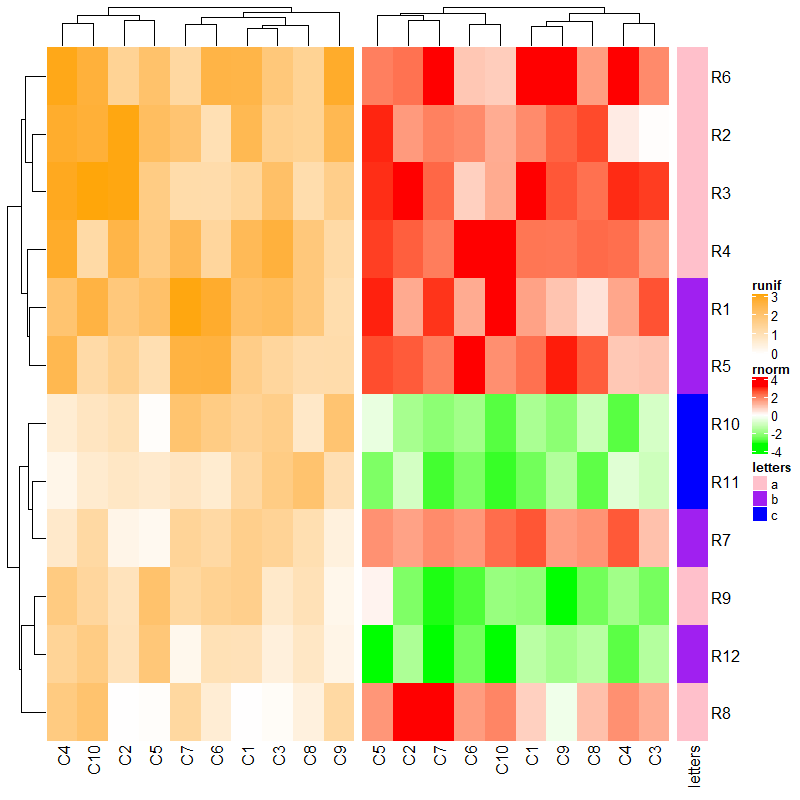
3.4 Automatic adjustment to the main heatmap
热图的行聚类及切割效果均以主热图为基准,默认放在最前面的为主热图。
ht1 = Heatmap(mat1, name = "rnorm", col = col_rnorm, row_km = 2)
ht2 = Heatmap(mat2, name = "runif", col = col_runif)
ht3 = Heatmap(le, name = "letters", col = col_letters)
ht2 + ht1 + ht3 # ht2 is the main heatmap and row_km in ht1 is ignored
下面是一些相关参数的示例:
ht_list = ht2 + ht1 + ht3
draw(ht_list, main_heatmap = "rnorm", # 调整主热图

     row_dend_side = "right", # 行树图位置

     row_sub_title_side = "left") # 行子标题位置
ht1 = Heatmap(mat1, name = "rnorm", col = col_rnorm)
ht2 = Heatmap(mat2, name = "runif", col = col_runif)
ht3 = Heatmap(le, name = "letters", col = col_letters)
ht_list = ht1 + ht2 + ht3
draw(ht_list, auto_adjust = FALSE)
draw(ht_list)
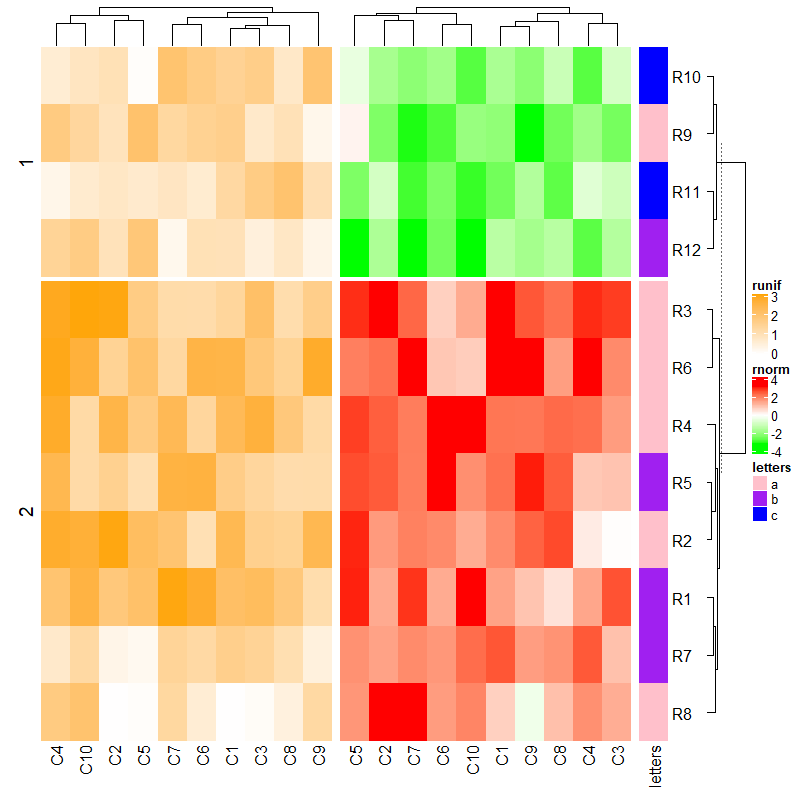
3.5 Control main heatmap in draw() function
In draw() function, following main heatmap settings control row orders of all heatmaps.
cluster_rowsclustering_distance_rowsclustering_method_rowsrow_dend_widthshow_row_dendrow_dend_reorderrow_dend_gprow_order
Following settings control the row slices.
row_gaprow_kmrow_km_repeatsrow_split
Following settings control the heatmap height.
heightheatmap_height
ht1 = Heatmap(mat1, name = "rnorm", col = col_rnorm, row_km = 2, cluster_rows = FALSE)
ht2 = Heatmap(mat2, name = "runif", col = col_runif)
ht3 = Heatmap(le, name = "letters", col = col_letters)
ht_list = ht1 + ht2 + ht3
draw(ht_list, row_km = 1,
     row_split = le,
     cluster_rows = TRUE)
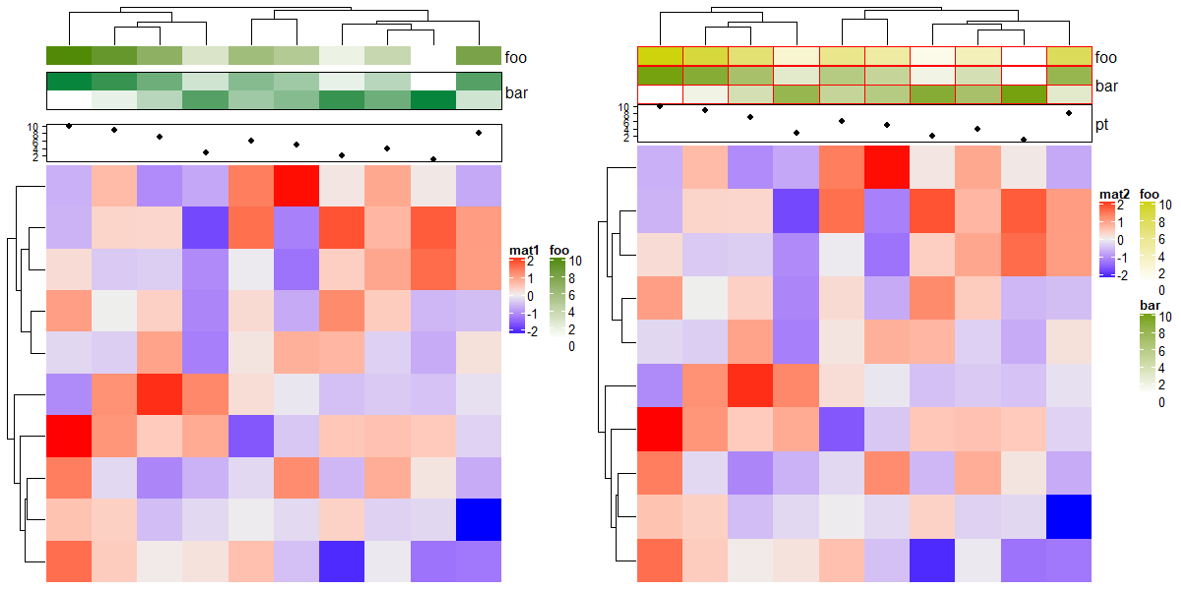
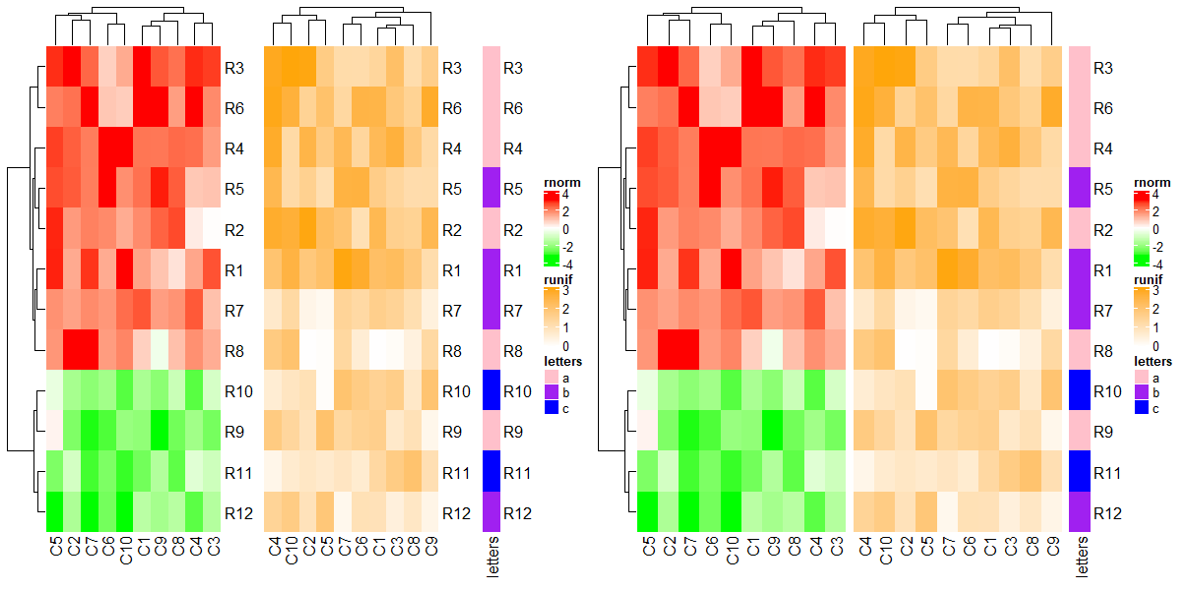
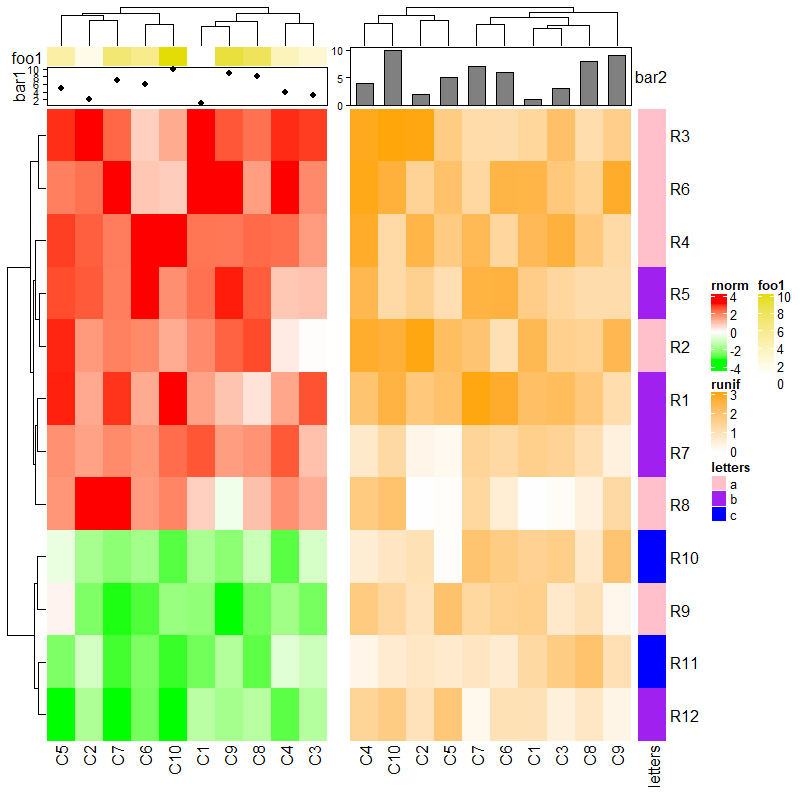
3.6 Annotations as components are adjusted
每个热图不全是简单注释的热图会自动对齐注释,如果在注释中已经设定了注释的高度的是不能自动对齐的。
ha1 = HeatmapAnnotation(foo1 = 1:10,
                        bar1 = anno_points(1:10),
                        annotation_name_side = "left")
ha2 = HeatmapAnnotation(bar2 = anno_barplot(1:10))
ht1 = Heatmap(mat1, name = "rnorm", col = col_rnorm, top_annotation = ha1)
ht2 = Heatmap(mat2, name = "runif", col = col_runif, top_annotation = ha2)
ht3 = Heatmap(le, name = "letters", col = col_letters)
ht_list = ht1 + ht2 + ht3
draw(ht_list, ht_gap = unit(c(6, 2), "mm"))
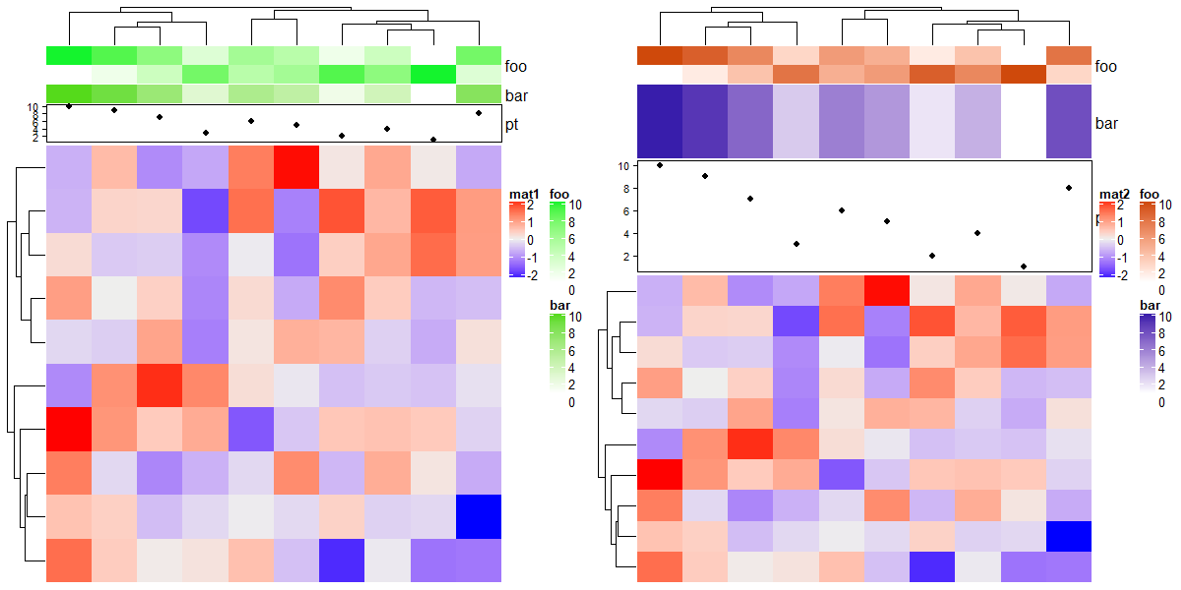
有和无注释的热图不能自动对齐注释。
ha1 = HeatmapAnnotation(foo1 = 1:10, annotation_name_side = "left")
ht1 = Heatmap(mat1, name = "rnorm", col = col_rnorm, top_annotation = ha1)
ht2 = Heatmap(mat2, name = "runif", col = col_runif)
ht3 = Heatmap(le, name = "letters", col = col_letters)
ht1 + ht2 + ht3

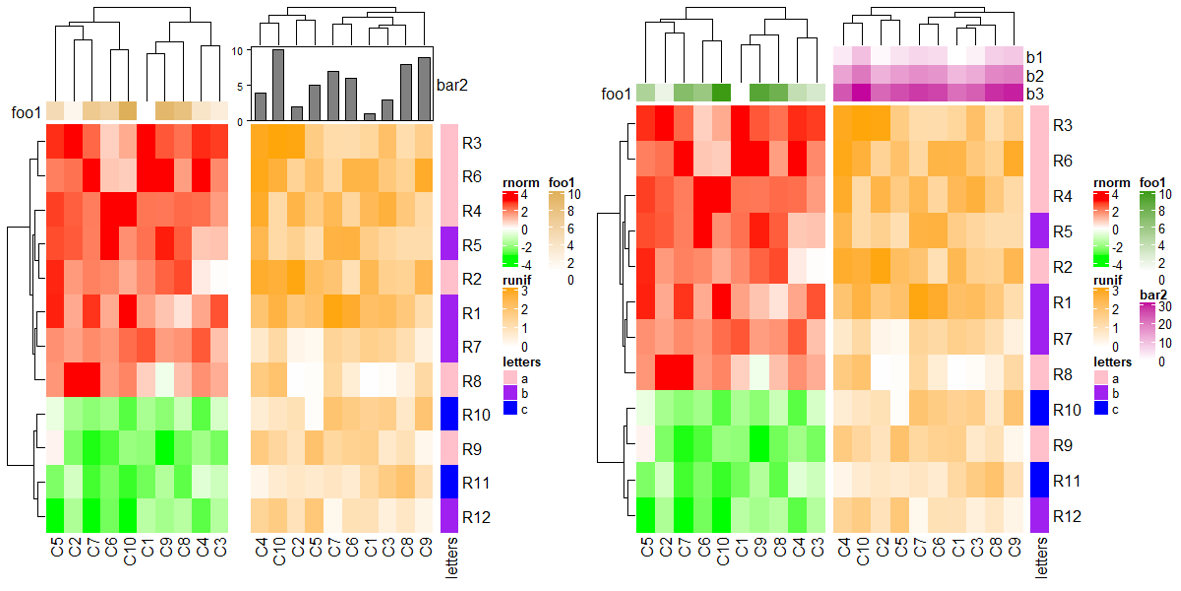
下面的情况就是至少有一个热图全是简单注释从而不能自动对齐。
ha1 = HeatmapAnnotation(foo1 = 1:10, annotation_name_side = "left")
ha2 = HeatmapAnnotation(bar2 = anno_barplot(1:10, height = unit(2, "cm")))
ht1 = Heatmap(mat1, name = "rnorm", col = col_rnorm, top_annotation = ha1)
ht2 = Heatmap(mat2, name = "runif", col = col_runif, top_annotation = ha2)
ht3 = Heatmap(le, name = "letters", col = col_letters)
ht_list = ht1 + ht2 + ht3
draw(ht_list, ht_gap = unit(c(6, 2), "mm"))
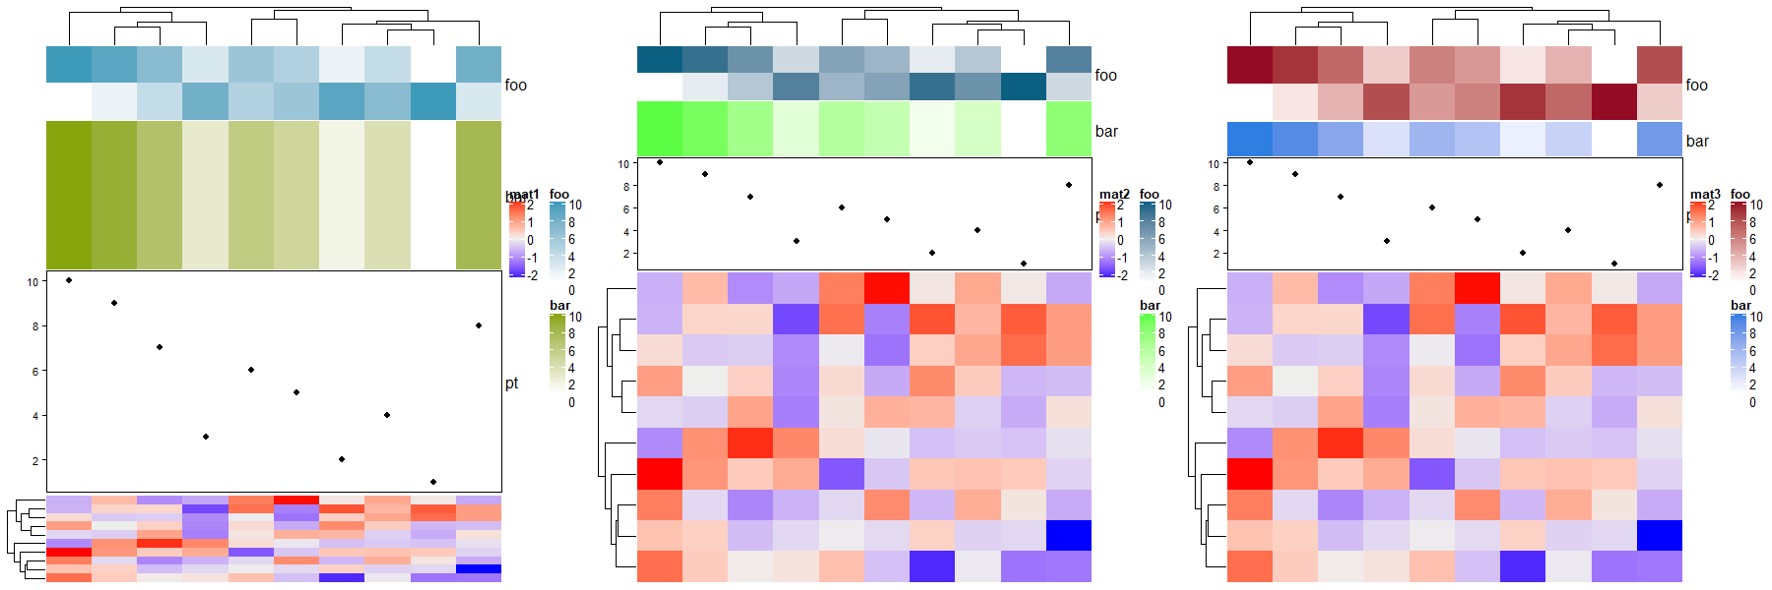
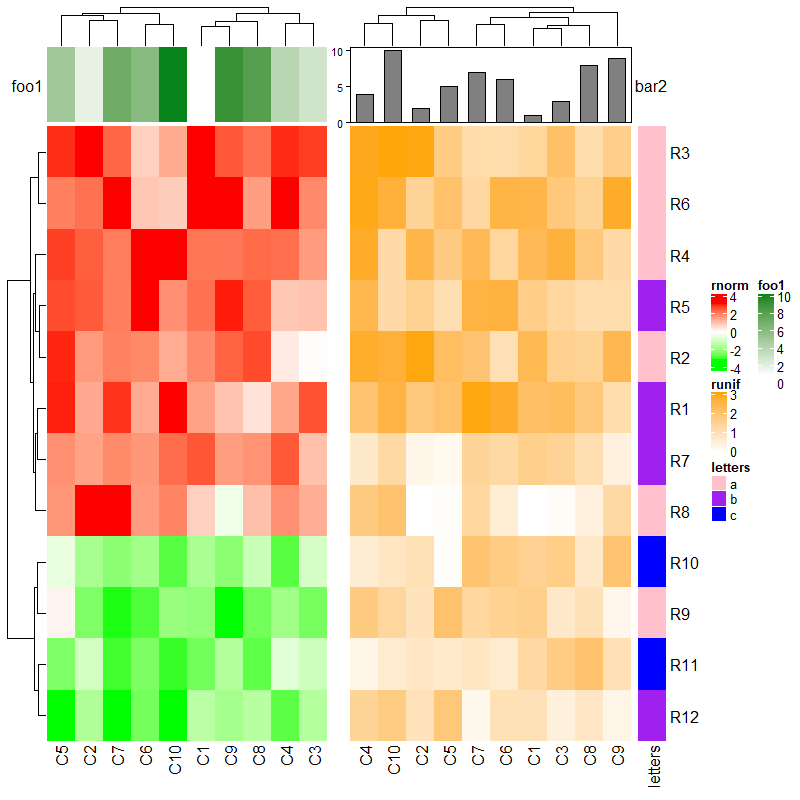
ha1 = HeatmapAnnotation(foo1 = 1:10, annotation_name_side = "left")
ha2 = HeatmapAnnotation(bar2 = cbind(b1 = 1:10, b2 = 11:20, b3 = 21:30))
ht1 = Heatmap(mat1, name = "rnorm", col = col_rnorm, top_annotation = ha1)
ht2 = Heatmap(mat2, name = "runif", col = col_runif, top_annotation = ha2)
ht3 = Heatmap(le, name = "letters", col = col_letters)
ht_list = ht1 + ht2 + ht3
draw(ht_list)
想要保持注释对齐的话,可以在 HeatmapAnnotation 中加 simple_anno_size_adjust = TRUE。
ha1 = HeatmapAnnotation(foo1 = 1:10, annotation_name_side = "left", simple_anno_size_adjust = TRUE)
ha2 = HeatmapAnnotation(bar2 = anno_barplot(1:10, height = unit(2, "cm")))
ht1 = Heatmap(mat1, name = "rnorm", col = col_rnorm, top_annotation = ha1)
ht2 = Heatmap(mat2, name = "runif", col = col_runif, top_annotation = ha2)
ht3 = Heatmap(le, name = "letters", col = col_letters)
ht_list = ht1 + ht2 + ht3
draw(ht_list, ht_gap = unit(c(6, 2), "mm"))
第二个热图无底部注释,第一个热图的列名会直接置于最下。
ha1 = HeatmapAnnotation(foo1 = 1:10, bar1 = anno_points(1:10), annotation_name_side = "left")
ht1 = Heatmap(mat1, name = "rnorm", col = col_rnorm, bottom_annotation = ha1)
ht2 = Heatmap(mat2, name = "runif", col = col_runif)
ht3 = Heatmap(le, name = "letters", col = col_letters)
ht_list = ht1 + ht2 + ht3
draw(ht_list)
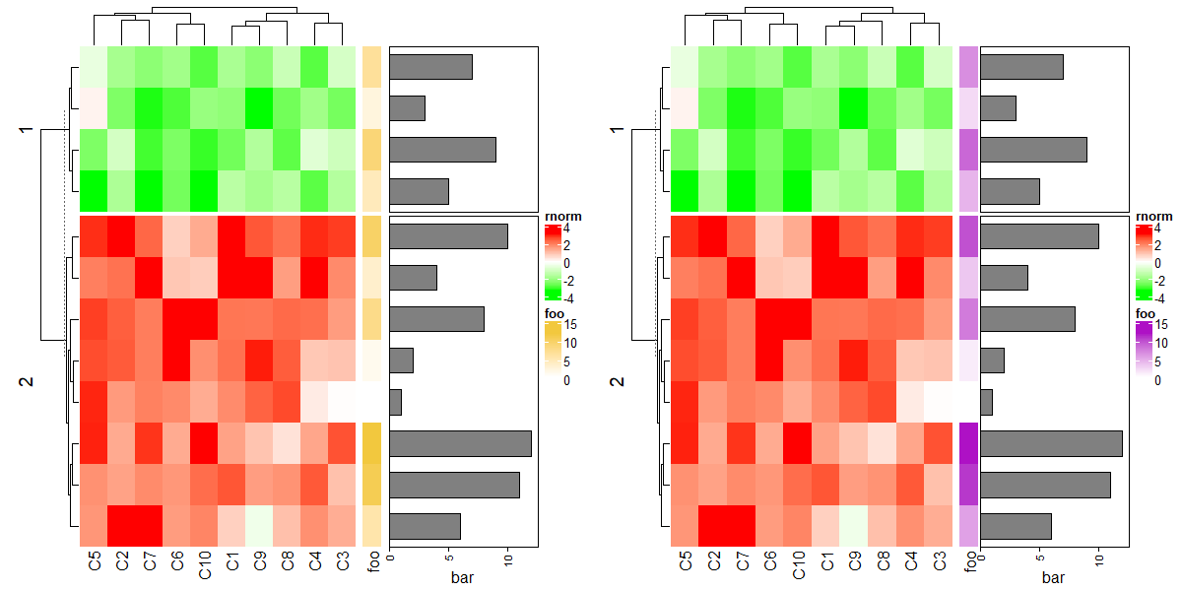
3.7 Concatenate with annotations
# 热图和注释连接

ha1 = rowAnnotation(foo = 1:12, bar = anno_barplot(1:12, width = unit(4, "cm")))
ht1 = Heatmap(mat1, name = "rnorm", col = col_rnorm, row_km = 2)
ht1 + ha1

# 下面代码等同上面

Heatmap(mat1, name = "rnorm", col = col_rnorm, row_km = 2) +
  rowAnnotation(foo = 1:12) +
  rowAnnotation(bar = anno_barplot(1:12, width = unit(4, "cm")))
rowAnnotation(foo = 1:12) +
  Heatmap(mat1, name = "rnorm", col = col_rnorm, row_km = 2) +
  rowAnnotation(bar = anno_barplot(1:12, width = unit(4, "cm"))) +
  Heatmap(mat2, name = "runif", col = col_runif)
3.8 Concatenate only the annotations
# 没有热图也是可以的

rowAnnotation(foo = 1:12) +
  rowAnnotation(bar = anno_barplot(1:12, width = unit(4, "cm")))

# 只有一个注释则必须额外加上NULL

rowAnnotation(bar = anno_barplot(1:12, width = unit(4, "cm"))) + NULL

# 同样可以使用draw里面的功能进行操作

anno_list = rowAnnotation(foo = 1:12) +
  rowAnnotation(bar = anno_barplot(1:12, width = unit(4, "cm")))
draw(anno_list, row_split = rep(c("A", "B"), each = 6))
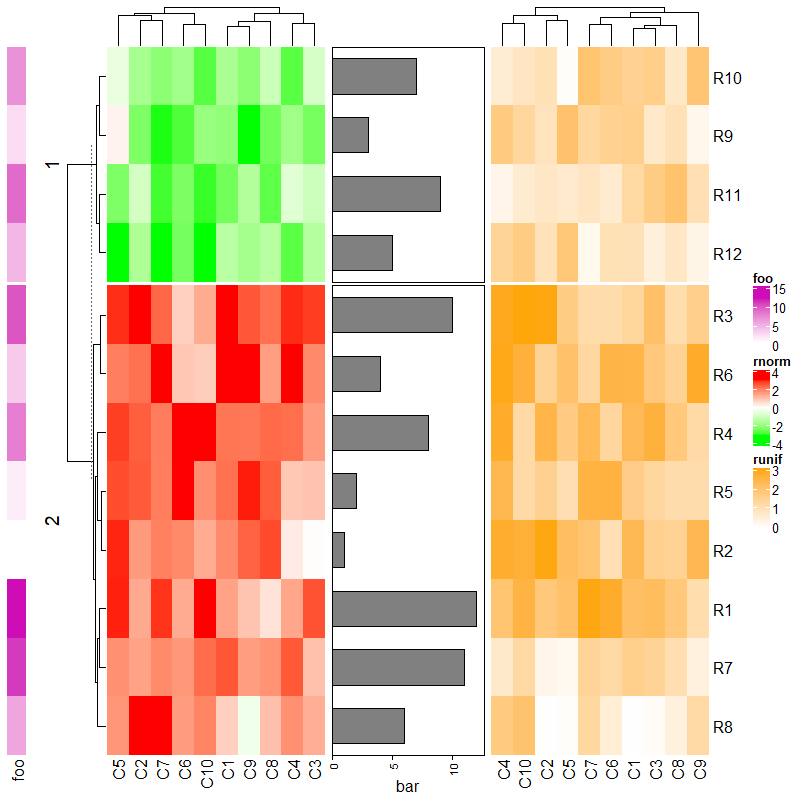
3.9 Vertical concatenation
纵向连接使用 %v% ,其余参数均类似于横向连接,下面代码可以自行体会。
mat1t = t(mat1)
mat2t = t(mat2)
ht1 = Heatmap(mat1t, name = "rnorm", col = col_rnorm, row_title = "rnorm")
ht2 = Heatmap(mat2t, name = "runif", col = col_runif, row_title = "runif")
ht3 = Heatmap(rbind(letters = le), name = "letters", col = col_letters)
ht_list = ht1 %v% ht2 %v% ht3
draw(ht_list)
draw(ht_list, column_km = 2)

ha = HeatmapAnnotation(foo = anno_barplot(1:12, height = unit(2, "cm")))
ht_list = ht1 %v% ha %v% ht2 %v% ht3
draw(ht_list, column_km = 2)

ht1 = Heatmap(mat1t, name = "rnorm", col = col_rnorm, row_km = 2)
ht2 = Heatmap(mat2t, name = "runif", col = col_runif, row_km = 2)
ht3 = Heatmap(rbind(letters = le), name = "letters", col = col_letters)
ha = HeatmapAnnotation(foo = anno_barplot(1:12, height = unit(2, "cm")))
ht_list = ht1 %v% ha %v% ht2 %v% ht3
draw(ht_list, column_km = 2)

ht1 = Heatmap(mat1t, name = "rnorm", col = col_rnorm, row_km = 2,
              left_annotation = rowAnnotation(foo1 = 1:10, bar1 = anno_barplot(1:10)))
ha = HeatmapAnnotation(foo = anno_barplot(1:12, height = unit(2, "cm"),
                                          axis_param = list(side = "right")))
ht2 = Heatmap(mat2t, name = "runif", col = col_runif, row_km = 2,
              left_annotation = rowAnnotation(foo2 = 1:10))
ht3 = Heatmap(rbind(letters = le), name = "letters", col = col_letters)
ht_list = ht1 %v% ha %v% ht2 %v% ht3
draw(ht_list, column_km = 2)
3.10 Subset the heatmap list
与前面画单个热图的亚集类似。
ht1 = Heatmap(mat1, name = "rnorm", col = col_rnorm,
              left_annotation = rowAnnotation(foo1 = 1:12, bar1 = anno_points(1:12)))
ht2 = Heatmap(mat2, name = "runif", col = col_runif)
ha = rowAnnotation(foo2 = anno_barplot(1:12), bar2 = 12:1)
ht_list = ht1 + ht2 + ha
names(ht_list)
draw(ht_list)
ht_list[1:6, c("rnorm", "bar2")]
3.11 Get orders and dendrograms
同样与单个热图取顺序类似。
ht1 = Heatmap(mat1, name = "rnorm", col = col_rnorm)
ht2 = Heatmap(mat2, name = "runif", col = col_runif)
ht_list = ht1 + ht2
ht_list = draw(ht_list)
row_order(ht_list)
column_order(ht_list)

# 分割成多少块,获得的顺序也会化分成多少个

ht1 = Heatmap(mat1, name = "rnorm", col = col_rnorm)
ht2 = Heatmap(mat2, name = "runif", col = col_runif, column_km = 2)
ht_list = ht1 + ht2
ht_list = draw(ht_list, row_km = 2)
row_order(ht_list)
column_order(ht_list)

# 只获得其中一部分的顺序

column_order(ht_list, name = "runif")
3.12 Change parameters globally
ht_opt
There are following parameters to control all heatmaps:
heatmap_row_names_gp: setrow_names_gpin allHeatmap().heatmap_column_names_gp: setcolumn_names_gpin allHeatmap().heatmap_row_title_gp: setrow_title_gpin allHeatmap().heatmap_column_title_gp: setcolumn_title_gpin allHeatmap().heatmap_border: setborderin allHeatmap().
Following parameters control the legends:
legend_title_gp: settitle_gpin all heatmap legends and annotation legends.legend_title_position: settitle_positionin all heatmap legends and annotation legends.legend_labels_gp: setlabels_gpin all heatmap legends and annotation legends.legend_grid_width: setgrid_widthin all heatmap legends and annotation legends.legend_grid_height: setgrid_heightin all heatmap legends and annotation legends.legend_border: setborderin all heatmap legends and annotation legends.
Following parameters control heatmap annotations:
annotation_border: setborderin allHeatmapAnnotation().anno_simple_size: set size for the simple annotation.
Following parameters control the space between heatmap components:
DENDROGRAM_PADDING: space bewteen dendrograms and heatmap body.DIMNAME_PADDING: space between row/column names and heatmap body.TITLE_PADDING: space between row/column titles and heatmap body.COLUMN_ANNO_PADDING: space between column annotations and heatmap body.ROW_ANNO_PADDING: space between row annotations and heatmap body.
Other parameters:
fast_hclust: whether usefastcluster::hclust()to speed up clustering?show_parent_dend_line: when heatmap is split, whether to add a dashed line to mark parent dendrogram and children dendrograms?
ht_opt(heatmap_column_names_gp = gpar(fontface = "italic"),
       heatmap_column_title_gp = gpar(fontsize = 10),
       legend_border = "black",
       heatmap_border = TRUE,
       annotation_border = TRUE
)
ht1 = Heatmap(mat1, name = "ht1", column_title = "Heatmap 1",
              top_annotation = HeatmapAnnotation(foo = 1:10))
ht2 = Heatmap(mat2, name = "ht2", column_title = "Heatmap 2",
              top_annotation = HeatmapAnnotation(bar = 1:10))
ht1 + ht2
ht_opt(RESET = TRUE) # 重置为默认配置
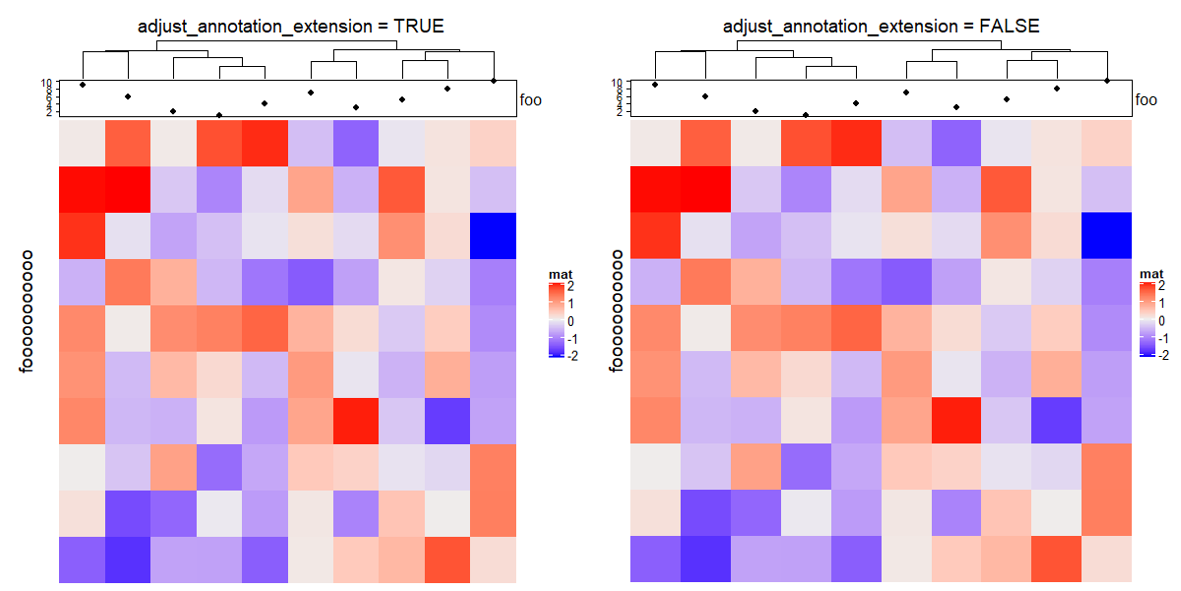
3.13 Adjust blank space caused by annotations
m = matrix(rnorm(100), 10)
ht = Heatmap(m, name = "mat",
             top_annotation = HeatmapAnnotation(foo = anno_points(1:10)),
             show_row_dend = FALSE)
draw(ht, row_title = "fooooooooooo", adjust_annotation_extension = TRUE,  # default

     column_title = "adjust_annotation_extension = TRUE")
draw(ht, row_title = "fooooooooooo", adjust_annotation_extension = FALSE,
     column_title = "adjust_annotation_extension = FALSE")
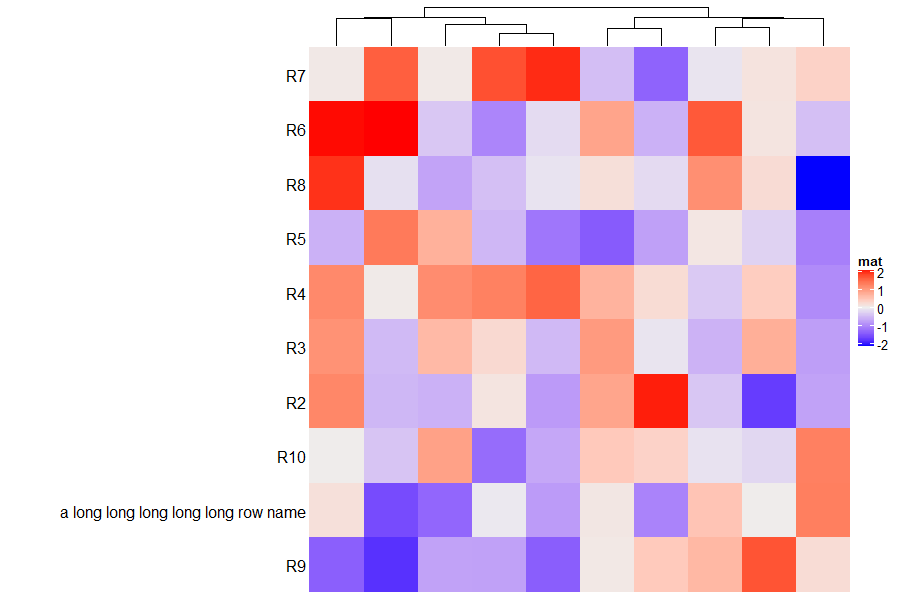
3.14 Manually increase space around the plot
m2 = m
rownames(m2) = paste0("R", 1:10)
rownames(m2)[1] = "a long long long long long row name"
ht = Heatmap(m2, name = "mat", row_names_side = "left", show_row_dend = FALSE)
draw(ht, padding = unit(c(2, 20, 2, 2), "mm")) ## see right heatmap in following
4 Legends
4.1 Continuous legends
rm(list = ls())
library(ComplexHeatmap)
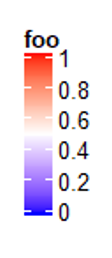
col_fun = circlize::colorRamp2(c(0, 0.5, 1), c("blue", "white", "red"))
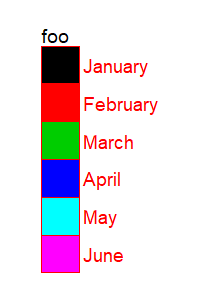
lgd = Legend(col_fun = col_fun, title = "foo")
draw(lgd)
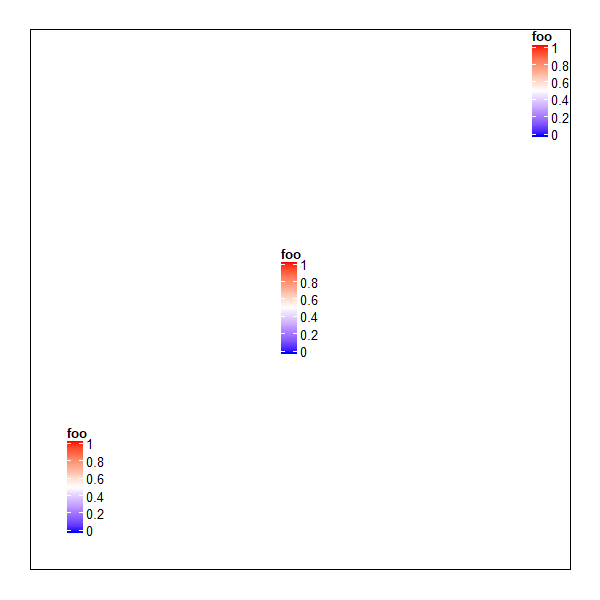
需要单独画图例的时候,可以利用 draw() 来调节图例的位置。
pushViewport(viewport(width = 0.9, height = 0.9))
grid.rect()  # border

draw(lgd, x = unit(1, "cm"), y = unit(1, "cm"), just = c("left", "bottom"))
draw(lgd, x = unit(0.5, "npc"), y = unit(0.5, "npc"))
draw(lgd, x = unit(1, "npc"), y = unit(1, "npc"), just = c("right", "top"))
popViewport()
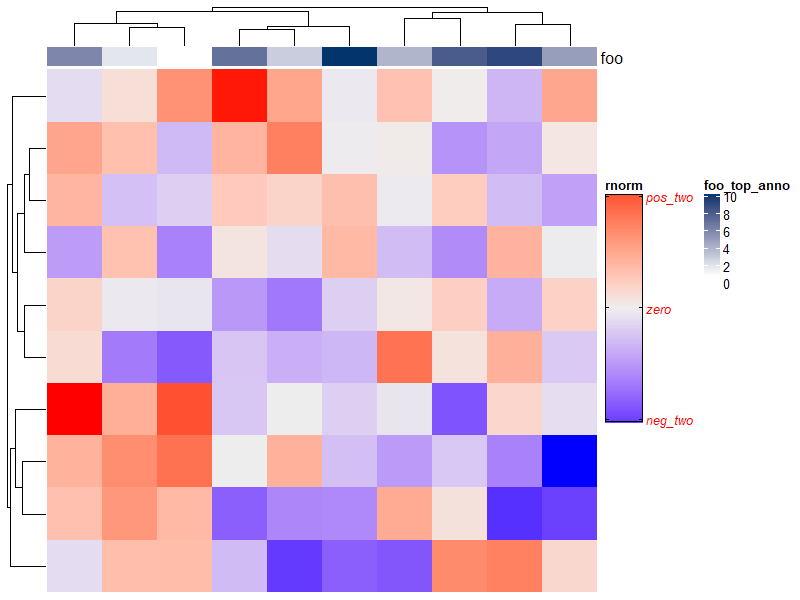
Heatmap(matrix(rnorm(100), 10),
        heatmap_legend_param = list(
          title = "rnorm", # 标题

          title_position = "topleft", # 标题位置(topleft, topcenter, leftcenter-rot and lefttop-rot are only for vertical legend and leftcenter, lefttop are only for horizontal legend.)

          legend_height = unit(6, "cm"), #t图例主体高度

          grid_width = unit(1, "cm"), # 宽度

          # legend_width = unit(1, "cm"), # 宽度,作用于连续的水平图例

          labels_gp = gpar(col = "red", font = 3), # label的颜色及大小

          border = "black", # 边框颜色

          at = c(-2, 0, 2),  # Break values of the legend

          labels = c("neg_two", "zero", "pos_two"),# Labels corresponding to break values

          labels_rot = 180),
        top_annotation = HeatmapAnnotation(
          foo = 1:10,
          annotation_legend_param = list(foo = list(title = "foo_top_anno"))))
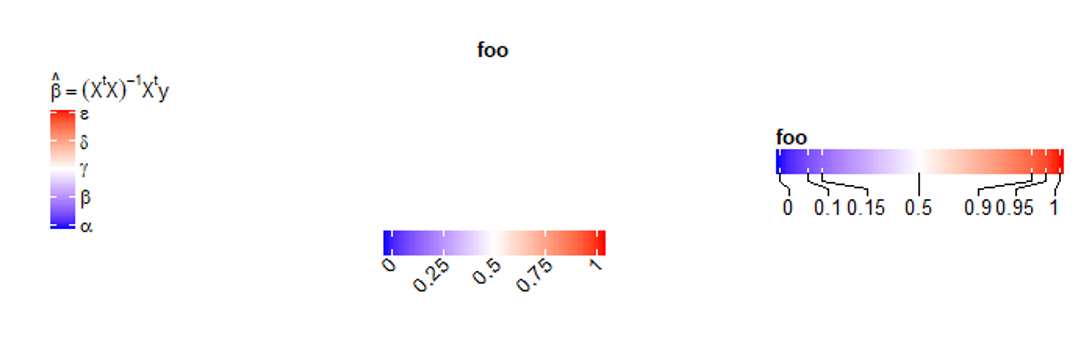
# 支持数学表达式

lgd = Legend(col_fun = col_fun, title = expression(hat(beta) == (X^t * X)^{-1} * X^t * y),
             at = c(0, 0.25, 0.5, 0.75, 1), labels = expression(alpha, beta, gamma, delta, epsilon))
draw(lgd)

# 水平图例(大部分参数同上)

lgd = Legend(col_fun = col_fun, title = "foo", at = c(0, 0.25, 0.5, 0.75, 1),
             title_gap = unit(3, "cm"), # 标题和主体的间隔

             title_position = "topcenter",
             direction = "horizontal", # 设置为水平("vertical", "horizontal")

             labels_rot = 45)
draw(lgd)
4.2 Discrete legends
与连续型图例参数类似,直接看下面代码。
lgd = Legend(at = 1:6,
             direction = "vertical",
             title = "foo",
             title_position = "topleft",
             labels = month.name[1:6],
             grid_height = unit(1, "cm"), # 区别于前面的legend_height

             grid_width = unit(10, "mm"),
             border = "red",
             legend_gp = gpar(fill = 1:6),
             labels_gp = gpar(col = "red", fontsize = 14),
             title_gp = gpar(col = "black",
                             fontsize = 14))
draw(lgd)
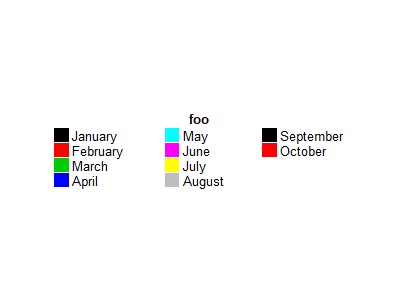
图例太多的话,可以使用 ncol/nrow 来分组。
lgd = Legend(labels = month.name[1:10], legend_gp = gpar(fill = 1:10), title = "foo",  title_position = "topcenter",
             gap = unit(1, "cm"), # 设置间隔大小

             ncol = 3)
draw(lgd)
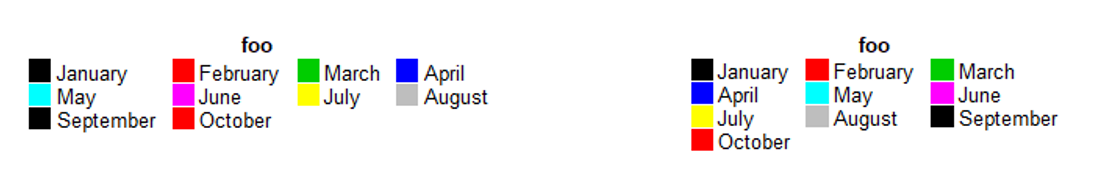
ncol/nrow 默认按行排序,按列排序需要使用 by_row。
lgd = Legend(labels = month.name[1:10], legend_gp = gpar(fill = 1:10), title = "foo",  title_position = "topcenter",
             ncol = 3,
             by_row = TRUE)
draw(lgd)

lgd = Legend(labels = month.name[1:10], legend_gp = gpar(fill = 1:10), title = "foo",  title_position = "topcenter",
             nrow = 3,
             by_row = TRUE)
draw(lgd)
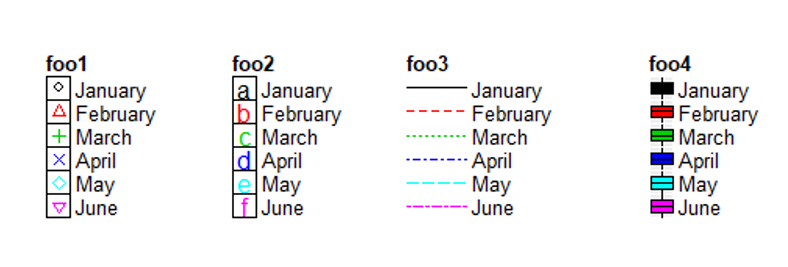
# 使用 points 图例

lgd = Legend(labels = month.name[1:6], title = "foo1",
             type = "points",
             pch = 1:6, # 数字表示不同的形状

             border = "black", legend_gp = gpar(col = 1:6), background = "white")
draw(lgd)

lgd = Legend(labels = month.name[1:6], title = "foo1",
             type = "points",
             pch = letters[1:6],# 传入字母

             border = "black", legend_gp = gpar(col = 1:6), background = "white")
draw(lgd)

# 使用 lines 画图例

lgd = Legend(labels = month.name[1:6], title = "foo3",
             type = "lines",
             legend_gp = gpar(col = 1:6,
                              lty = 1:6), # 数字表示不同线的种类

             grid_width = unit(1, "cm"),
             border = "white", background = "white")
draw(lgd)

# 使用 boxplot 画图例

lgd = Legend(labels = month.name[1:6], title = "foo4", type = "boxplot",
             legend_gp = gpar(fill = 1:6))
draw(lgd)
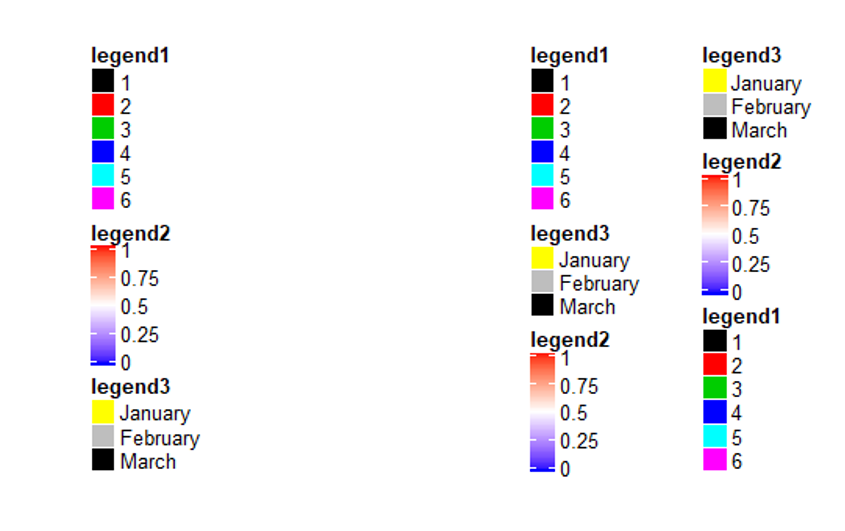
4.3 A list of legends
lgd1 = Legend(at = 1:6, legend_gp = gpar(fill = 1:6), title = "legend1")
lgd2 = Legend(col_fun = col_fun, title = "legend2", at = c(0, 0.25, 0.5, 0.75, 1))
lgd3 = Legend(labels = month.name[1:3], legend_gp = gpar(fill = 7:9), title = "legend3")

# 下面两种写法效果一样

pd = packLegend(lgd1, lgd2, lgd3)
pd = packLegend(list = list(lgd1, lgd2, lgd3))
draw(pd)


pd = packLegend(lgd1, lgd3, lgd2, lgd3, lgd2, lgd1,
                direction = "vertical", # "vertical", "horizontal"

                max_height = unit(10, "cm"), # 整个图例的最大高度

                column_gap = unit(1, "cm")) # 列间隔

draw(pd)
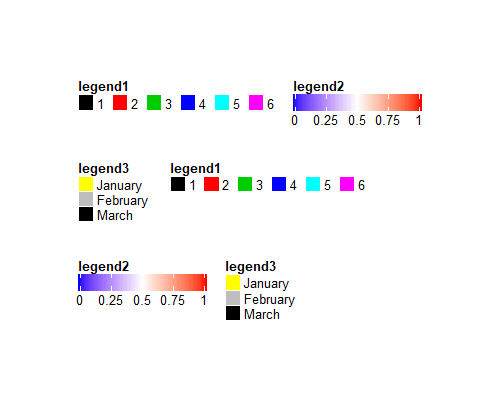
lgd1 = Legend(at = 1:6, legend_gp = gpar(fill = 1:6), title = "legend1",
              nr = 1)
lgd2 = Legend(col_fun = col_fun, title = "legend2", at = c(0, 0.25, 0.5, 0.75, 1),
              direction = "horizontal")

pd = packLegend(lgd1, lgd2, lgd3, lgd1, lgd2, lgd3,
                direction = "horizontal", column_gap = unit(5, "mm"),
                max_width = unit(10, "cm"), # 整个图例的最大宽度

                row_gap = unit(1, "cm")) # 行间隔

draw(pd)
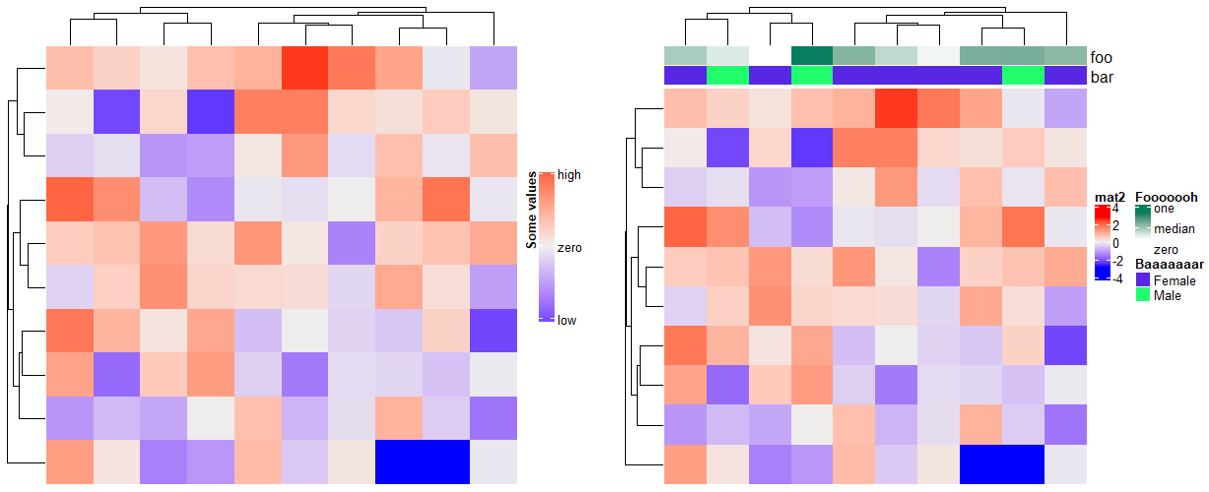
4.4 Heatmap and annotation legends
# 热图的图例(heatmap_legend_param),参数和上面基本一致。

m = matrix(rnorm(100), 10)
Heatmap(m, name = "mat1",
        heatmap_legend_param = list(
          at = c(-2, 0, 2),
          labels = c("low", "zero", "high"),
          title = "Some values",
          legend_height = unit(4, "cm"),
          title_position = "lefttop-rot"
        ))

# 注释的图例(annotation_legend_param),参数和上面基本一致

ha = HeatmapAnnotation(foo = runif(10),
                       bar = sample(c("f", "m"), 10, replace = TRUE),
                       annotation_legend_param = list(
                         foo = list(
                           title = "Fooooooh",
                           at = c(0, 0.5, 1),
                           labels = c("zero", "median", "one")
                         ),
                         bar = list(
                           title = "Baaaaaaar",
                           at = c("f", "m"),
                           labels = c("Female", "Male")
                         )
                       ))
Heatmap(m, name = "mat2", top_annotation = ha)
下面给出大量的例子以供体会。
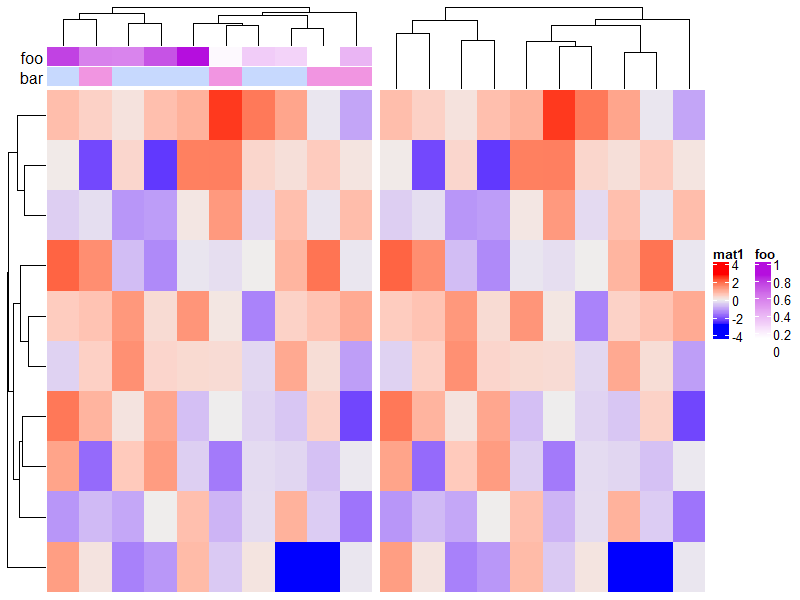
ha1 = HeatmapAnnotation(foo1 = runif(10), bar1 = sample(c("f", "m"), 10, replace = TRUE))
ha2 = HeatmapAnnotation(foo2 = runif(10), bar2 = sample(c("f", "m"), 10, replace = TRUE))
Heatmap(m, name = "mat1", top_annotation = ha1) +
  rowAnnotation(sth = runif(10)) +
  Heatmap(m, name = "mat2", top_annotation = ha2)
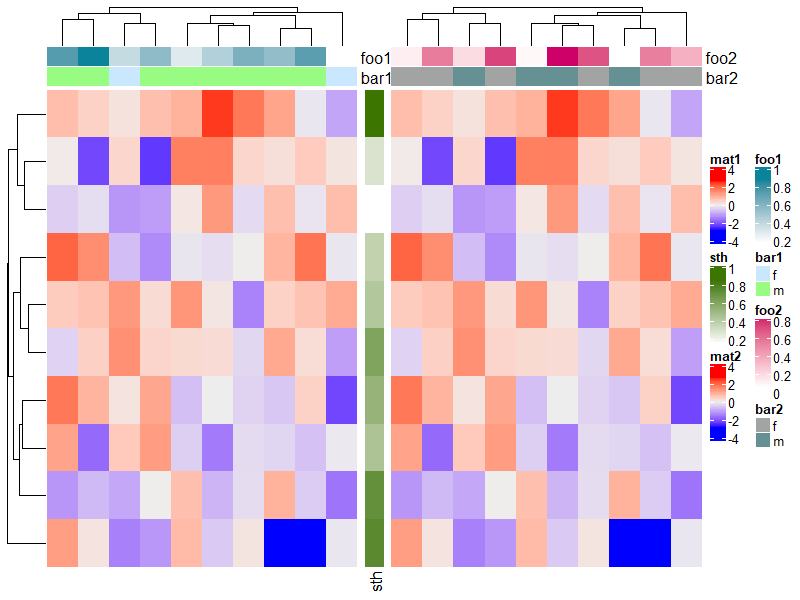
ha1 = HeatmapAnnotation(foo1 = runif(10), bar1 = sample(c("f", "m"), 10, replace = TRUE),
                        annotation_name_side = "left")
ha2 = HeatmapAnnotation(foo2 = runif(10), bar2 = sample(c("f", "m"), 10, replace = TRUE))
Heatmap(m, name = "mat1", top_annotation = ha1) %v%
  Heatmap(m, name = "mat2", top_annotation = ha2,
          right_annotation = rowAnnotation(sth = 1:10))
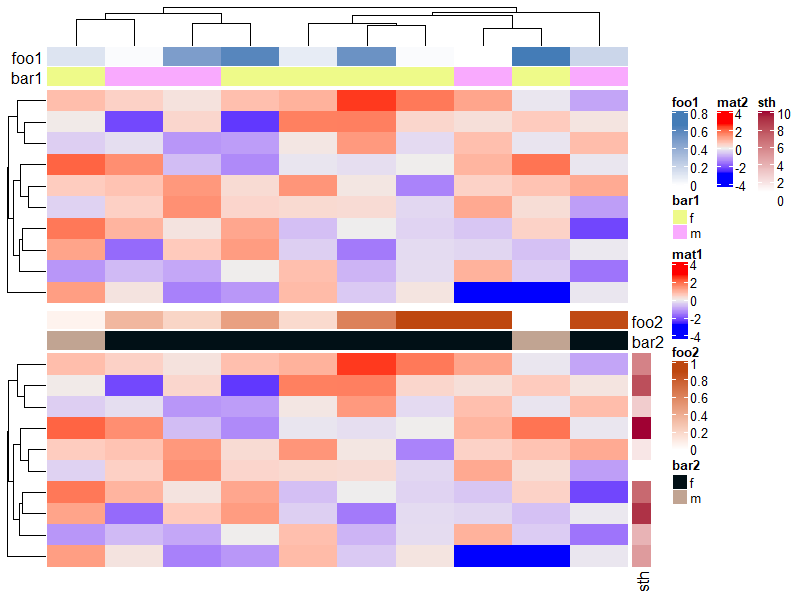
ha = HeatmapAnnotation(foo = runif(10),
                       bar = sample(c("f", "m"), 10, replace = TRUE),
                       show_legend = c(TRUE, FALSE), # it can also be show_legend = c(bar = FALSE)

                       annotation_name_side = "left")
Heatmap(m, name = "mat1", top_annotation = ha) +
  Heatmap(m, name = "mat2", show_heatmap_legend = FALSE)
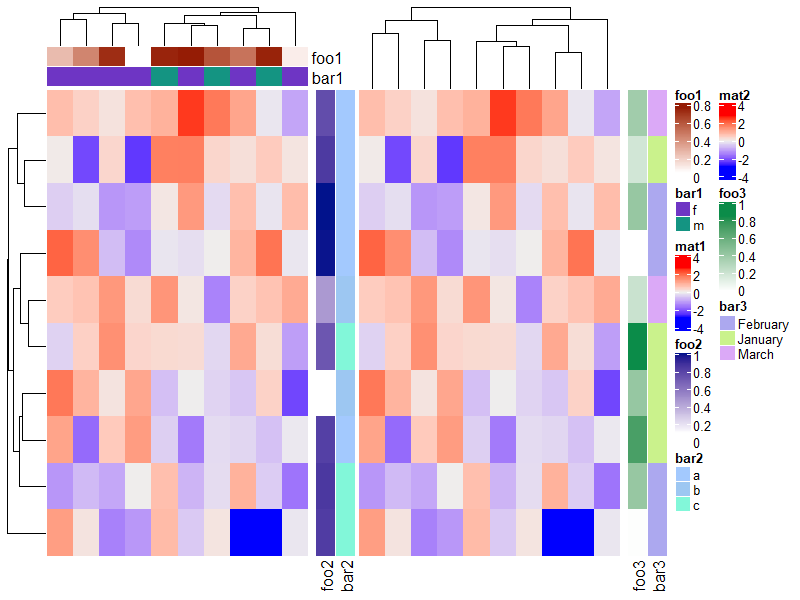
ha1 = HeatmapAnnotation(foo1 = runif(10),
                        bar1 = sample(c("f", "m"), 10, replace = TRUE))
ha2 = rowAnnotation(foo2 = runif(10),
                    bar2 = sample(letters[1:3], 10, replace = TRUE))
ha3 = rowAnnotation(foo3 = runif(10),
                    bar3 = sample(month.name[1:3], 10, replace = TRUE))
ht_list = Heatmap(m, name = "mat1", top_annotation = ha1) +
  Heatmap(m, name = "mat2", left_annotation = ha2) +
  ha3
draw(ht_list, merge_legend = TRUE)
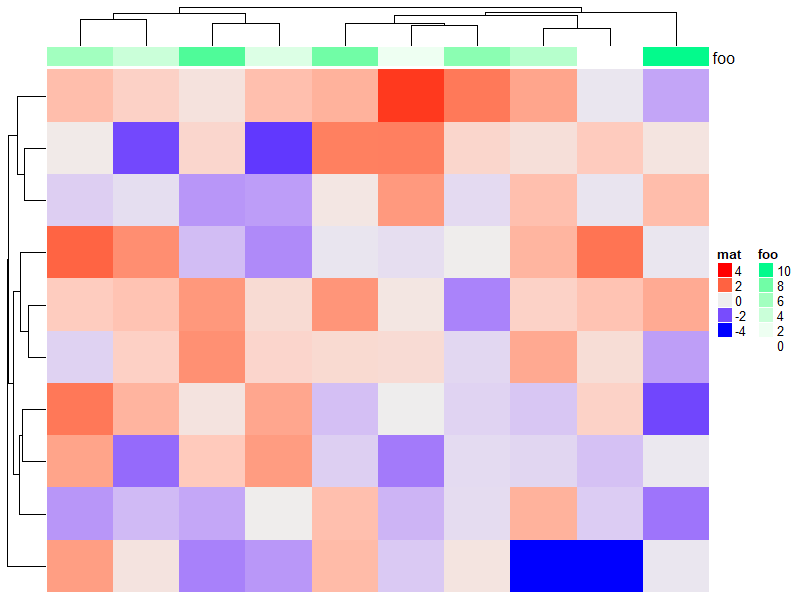
Heatmap(m, name = "mat", heatmap_legend_param = list(color_bar = "discrete"),
        top_annotation = HeatmapAnnotation(foo = 1:10,
                                           annotation_legend_param = list(
                                             foo = list(color_bar = "discrete"))))
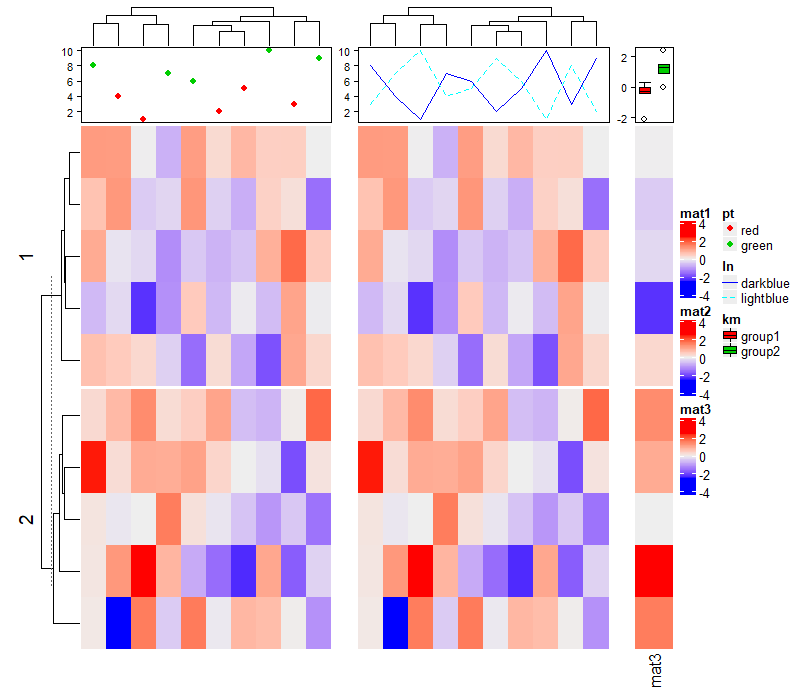
4.5 Add customized legends
ha1 = HeatmapAnnotation(pt = anno_points(1:10, gp = gpar(col = rep(2:3, each = 5)),
                                         height = unit(2, "cm")),
                        show_annotation_name = FALSE) # 不显示注释名

ha2 = HeatmapAnnotation(ln = anno_lines(cbind(1:10, 10:1), gp = gpar(col = 4:5, lty = 1:2),
                                        height = unit(2, "cm")),
                        show_annotation_name = FALSE)
m = matrix(rnorm(100), 10)
# 注释、热图及其图例

ht_list =
  Heatmap(m, name = "mat1", top_annotation = ha1) +
  Heatmap(m, name = "mat2", top_annotation = ha2) +
  Heatmap(m[, 1], name = "mat3",
          top_annotation = HeatmapAnnotation(
            summary = anno_summary(gp = gpar(fill = 2:3))
          ), width = unit(1, "cm"))
# 增加注释的图例

lgd_list = list(
  Legend(labels = c("red", "green"), title = "pt", type = "points", pch = 16,
         legend_gp = gpar(col = 2:3)),
  Legend(labels = c("darkblue", "lightblue"), title = "ln", type = "lines",
         legend_gp = gpar(col = 4:5, lty = 1:2)),
  Legend(labels = c("group1", "group2"), title = "km", type = "boxplot",
         legend_gp = gpar(fill = 2:3))
)
draw(ht_list, ht_gap = unit(7, "mm"), row_km = 2, annotation_legend_list = lgd_list)
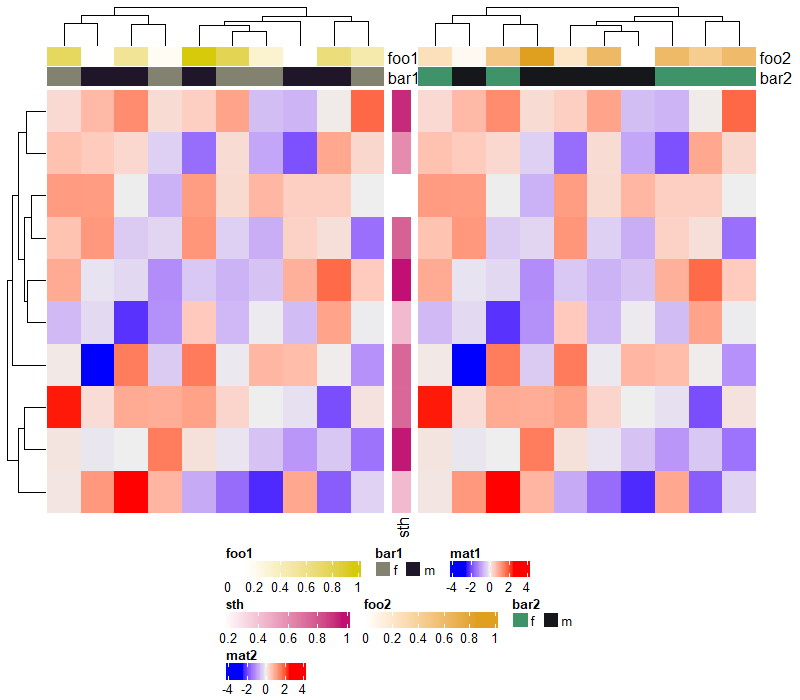
4.6 The side of legends
ha1 = HeatmapAnnotation(foo1 = runif(10), bar1 = sample(c("f", "m"), 10, replace = TRUE),
                        annotation_legend_param = list(
                          foo1 = list(direction = "horizontal"),
                          bar1 = list(nrow = 1)))
ha2 = HeatmapAnnotation(foo2 = runif(10), bar2 = sample(c("f", "m"), 10, replace = TRUE),
                        annotation_legend_param = list(
                          foo2 = list(direction = "horizontal"),
                          bar2 = list(nrow = 1)))
ht_list = Heatmap(m, name = "mat1", top_annotation = ha1,
                  heatmap_legend_param = list(direction = "horizontal")) +
  rowAnnotation(sth = runif(10),
                annotation_legend_param = list(sth = list(direction = "horizontal"))) +
  Heatmap(m, name = "mat2", top_annotation = ha2,
          heatmap_legend_param = list(direction = "horizontal"))
draw(ht_list,
     merge_legend = T,
     heatmap_legend_side = "bottom",
     annotation_legend_side = "bottom")
5 Heatmap Decoration
顾名思义,本节主要介绍热图的装饰美化,下图红框部分都是可进行操作的部分。
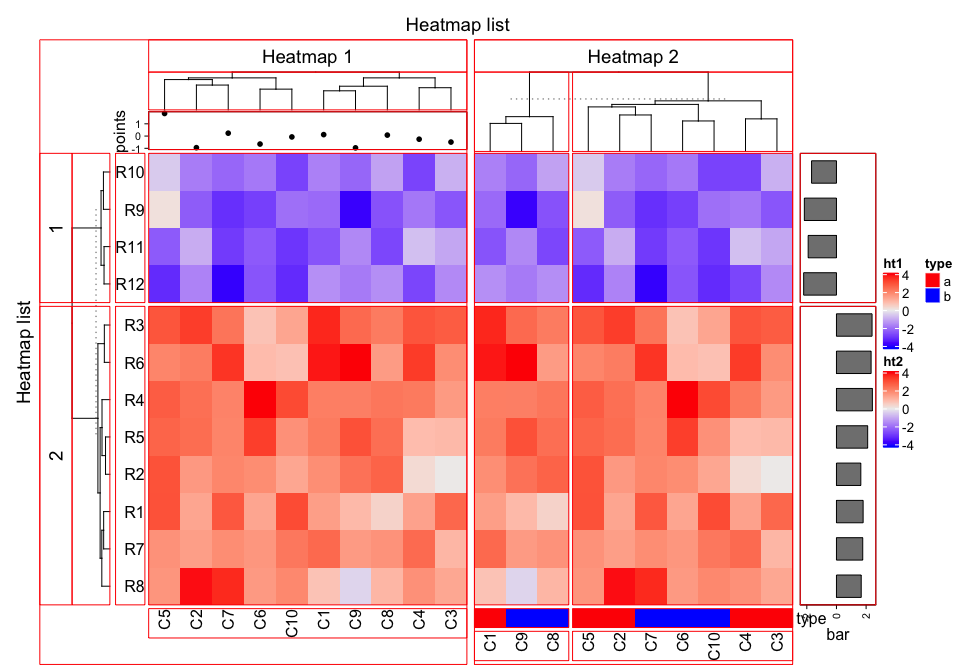
set.seed(123)
mat = matrix(rnorm(80, 2), 8, 10)
mat = rbind(mat, matrix(rnorm(40, -2), 4, 10))
rownames(mat) = paste0("R", 1:12)
colnames(mat) = paste0("C", 1:10)
ha_column1 = HeatmapAnnotation(points = anno_points(rnorm(10)),
annotation_name_side = "left")
ht1 = Heatmap(mat, name = "ht1", km = 2, column_title = "Heatmap 1",
top_annotation = ha_column1, row_names_side = "left")
ha_column2 = HeatmapAnnotation(type = c(rep("a", 5), rep("b", 5)),
col = list(type = c("a" = "red", "b" = "blue")))
ht2 = Heatmap(mat, name = "ht2", row_title = "Heatmap 2", column_title = "Heatmap 2",
bottom_annotation = ha_column2, column_km = 2)
ht_list = ht1 + ht2 +
rowAnnotation(bar = anno_barplot(rowMeans(mat), width = unit(2, "cm")))
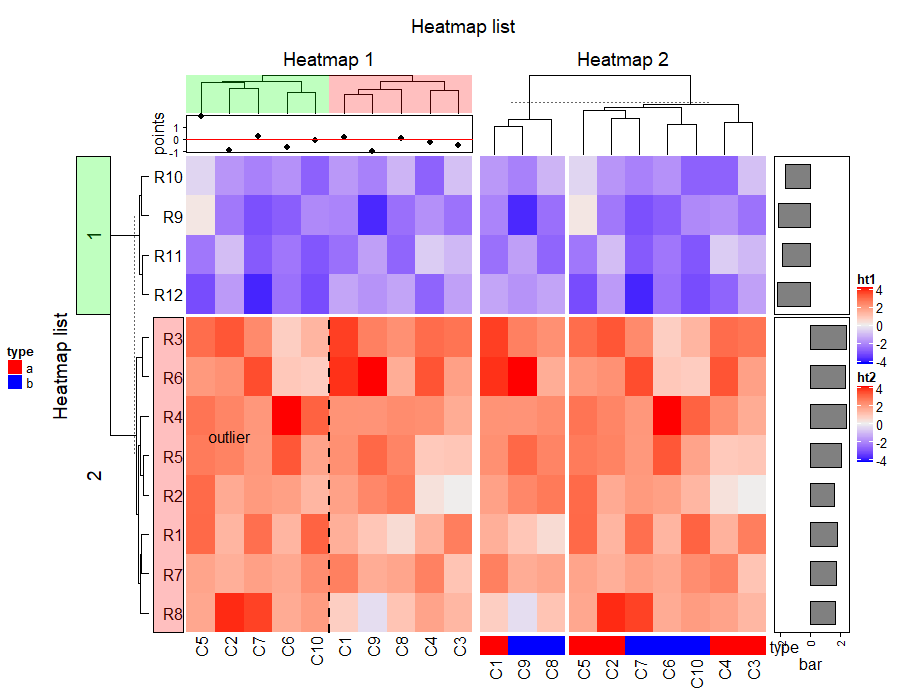
draw(ht_list, row_title = "Heatmap list", column_title = "Heatmap list")
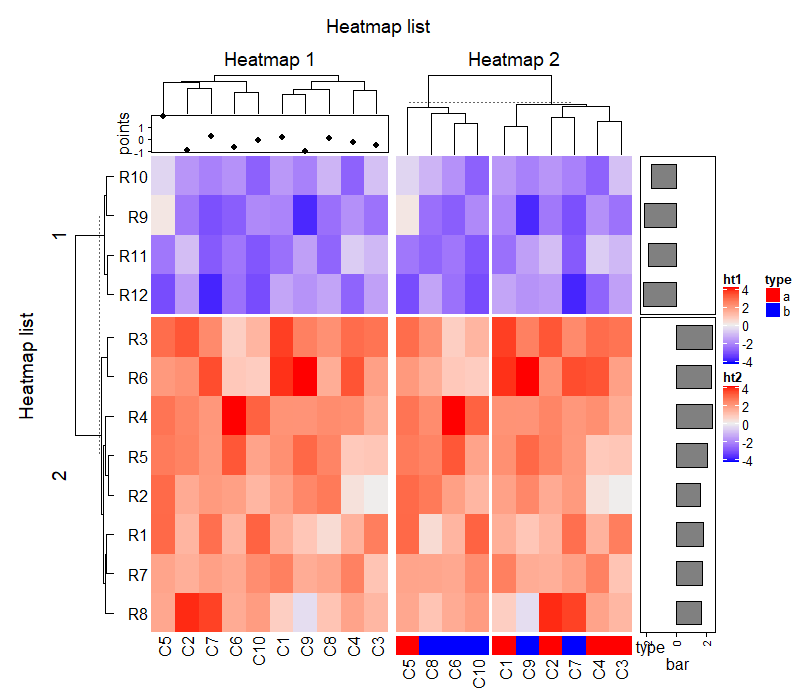
5.1 Decoration functions
There are following decoration functions.
decorate_heatmap_body()decorate_annotation()decorate_dend()decorate_title()decorate_dimnames()decorate_row_names(), identical to decorate_dimnames(…, which = “row”).decorate_column_names(), identical to decorate_dimnames(…, which = “column”).decorate_row_dend(), identical to decorate_dend(…, which = “row”).decorate_column_dend(), identical to decorate_dend(…, which = “column”).decorate_row_title(), identical to decorate_title(…, which = “row”).decorate_column_title(), identical to decorate_title(…, which = “column”).
依次运行下面代码查看就可以知道每个代码的作用。
ht_list = draw(ht_list, row_title = "Heatmap list", column_title = "Heatmap list",
               heatmap_legend_side = "right", annotation_legend_side = "left")

decorate_heatmap_body("ht1", {
  grid.text("outlier", 1.5/10, 2.5/4, default.units = "npc")
  grid.lines(c(0.5, 0.5), c(0, 1), gp = gpar(lty = 2, lwd = 2))
}, slice = 2)

decorate_column_dend("ht1", {
  tree = column_dend(ht_list)$ht1[[1]]
  ind = cutree(as.hclust(tree), k = 2)[order.dendrogram(tree)]

  first_index = function(l) which(l)[1]
  last_index = function(l) { x = which(l); x[length(x)] }
  x1 = c(first_index(ind == 1), first_index(ind == 2)) - 1
  x2 = c(last_index(ind == 1), last_index(ind == 2))
  grid.rect(x = x1/length(ind), width = (x2 - x1)/length(ind), just = "left",
            default.units = "npc", gp = gpar(fill = c("#FF000040", "#00FF0040"), col = NA))
})

decorate_row_names("ht1", {
  grid.rect(gp = gpar(fill = "#FF000040"))
}, slice = 2)

decorate_row_title("ht1", {
  grid.rect(gp = gpar(fill = "#00FF0040"))
}, slice = 1)

decorate_annotation("points", {
  grid.lines(c(0, 1), unit(c(0, 0), "native"), gp = gpar(col = "red"))
})
5.2 Examples
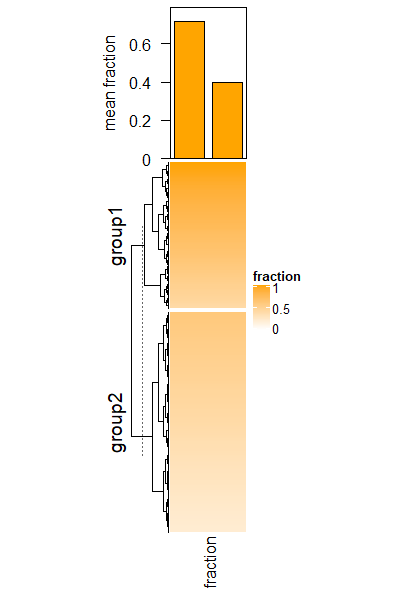
Barplot for single-column heatmap.
# DMRs

bed = generateRandomBed(nr = 1000)
# fractions

frac = c(runif(400, min = 0.4, max = 1), runif(nrow(bed) - 400, min = 0.2, max = 0.6))
col_fun = circlize::colorRamp2(c(0, 1), c("white", "orange"))
# two groups

split = c(rep("group1", 400), rep("group2", nrow(bed) - 400))
# draw the fraction heatmap with an empty annotation

ht = Heatmap(frac, name = "fraction", col = col_fun, width = unit(2, "cm"),
             top_annotation = HeatmapAnnotation(barplot = anno_empty(height = unit(4, "cm"))))
ht = draw(ht, row_split = split)
# get the row indices in the two row-groups

ro = row_order(ht)
w = bed[, 3] - bed[, 2]
# the mean weighted fraction in the two groups

p = sapply(ro, function(index) {
  sum(w[index]*frac[index])/sum(w[index])
})
# add two bars of `p`

decorate_annotation("barplot", {
  pushViewport(viewport(xscale = c(0.5, 2.5), yscale = c(0, max(p)*1.1)))
  grid.rect(x = 1:2, y = 0, width = 0.8, height = p, just = "bottom",
            gp = gpar(fill = "orange"), default.units = "native")
  grid.yaxis()
  grid.text("mean fraction", x = unit(-1.5, "cm"),rot = 90, just = "bottom")
  popViewport()
})
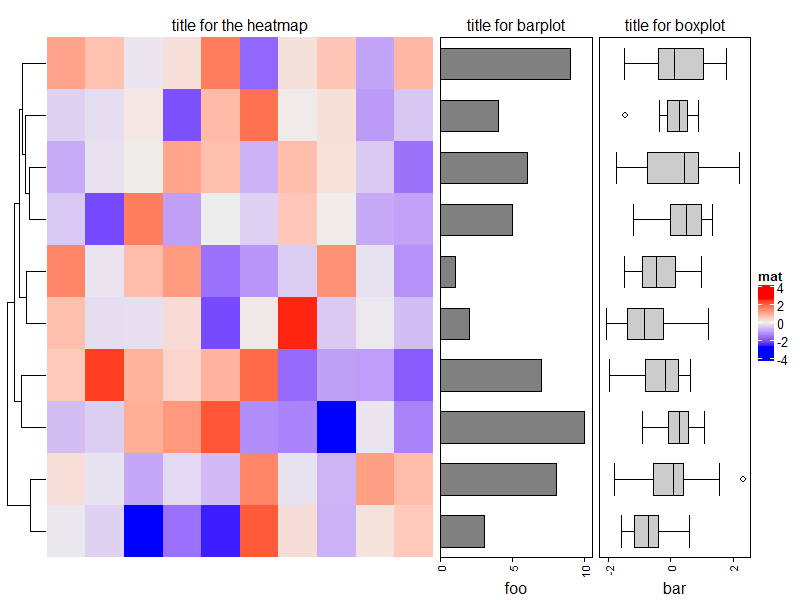
Add titles for row annotations.
ht_list = Heatmap(matrix(rnorm(100), 10), name = "mat", show_column_dend = FALSE) +
  rowAnnotation(foo = anno_barplot(1:10, width = unit(4, "cm"))) +
  rowAnnotation(bar = anno_boxplot(matrix(rnorm(100), 10)), width = unit(4, "cm"))
draw(ht_list, padding = unit(c(2, 2, 10, 2), "mm")) # add space for titles

decorate_annotation("foo", {
  grid.text("title for barplot", y = unit(1, "npc") + unit(2, "mm"), just = "bottom")
})
decorate_annotation("bar", {
  grid.text("title for boxplot", y = unit(1, "npc") + unit(2, "mm"), just = "bottom")
})
decorate_heatmap_body("mat", {
  grid.text("title for the heatmap", y = unit(1, "npc") + unit(2, "mm"), just = "bottom")
})
6 UpSet plot
6.1 Input data
准备好如下格式的数据。
rm(list = ls())
lt = list(set1 = c("a", "b", "c"),
          set2 = c("b", "c", "d", "e"))
list_to_matrix(lt)
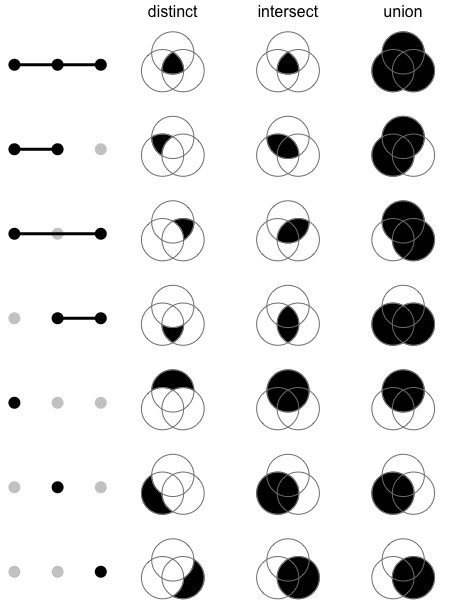
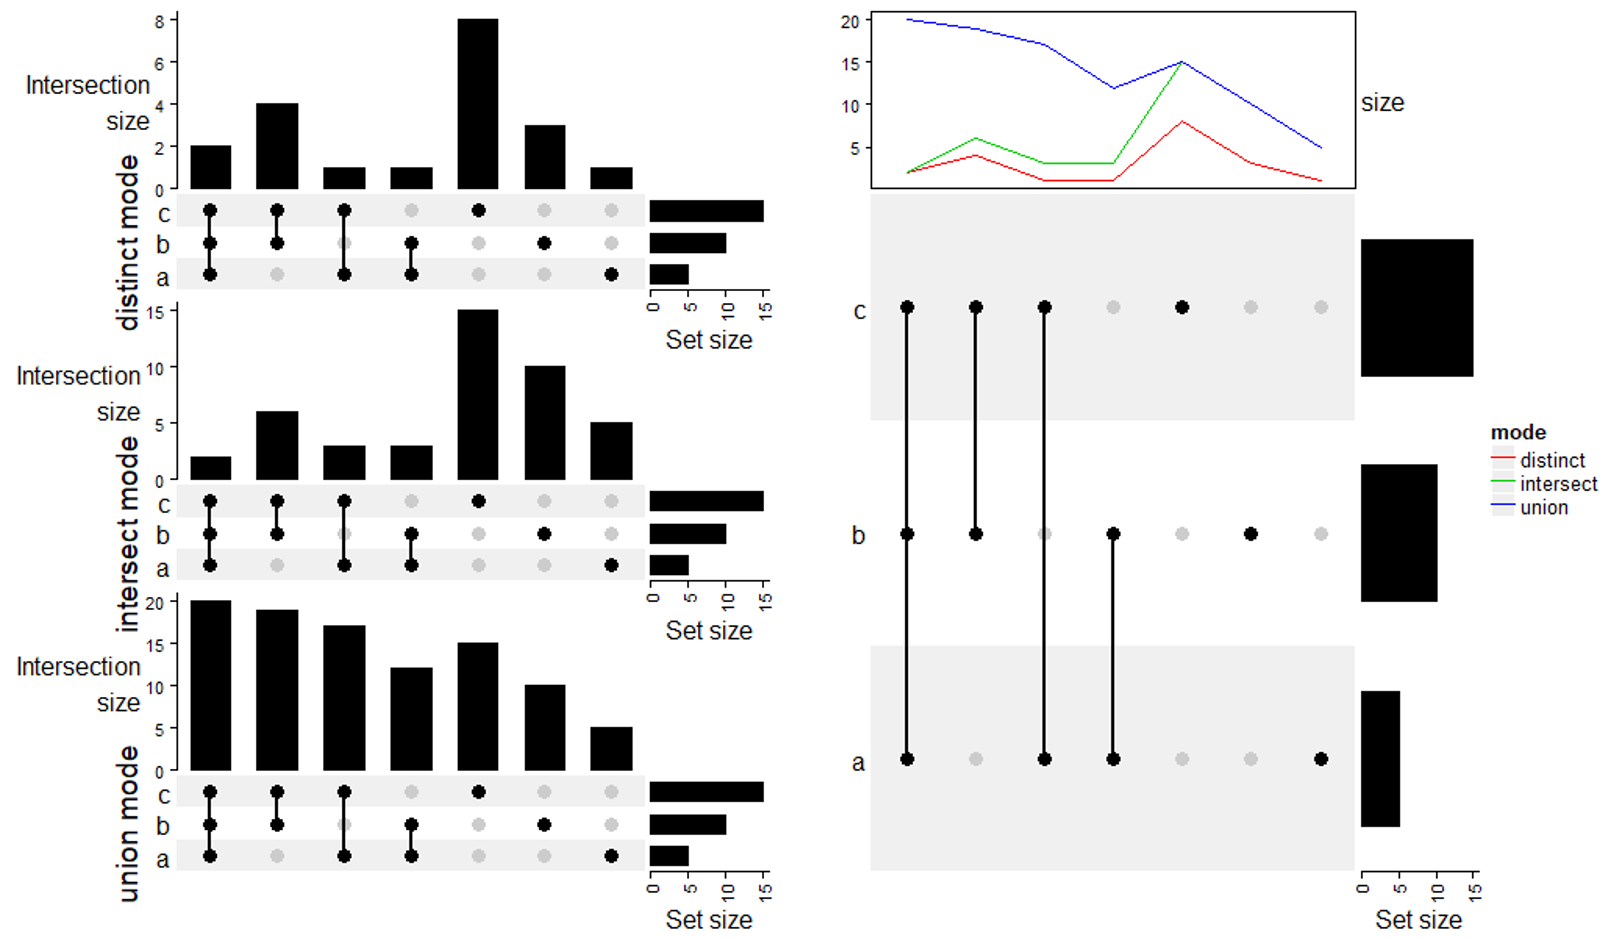
6.2 Mode
共有如下三种模式,三种模式的差别如下图所示。
- distinct mode
- intersect mode
- union mode
6.3 Make the combination matrix
数据准备
set.seed(123)
lt = list(a = sample(letters, 5),
          b = sample(letters, 10),
          c = sample(letters, 15))
make_comb_mat 生产比较矩阵
m1 = make_comb_mat(lt)
m2 = make_comb_mat(a = lt$a, b = lt$b, c = lt$c)
m3 = make_comb_mat(list_to_matrix(lt))
选择不同的模式,在此可以观察三者之间的差别。
m1 = make_comb_mat(lt) # the default mode is `distinct`

m2 = make_comb_mat(lt, mode = "intersect")
m3 = make_comb_mat(lt, mode = "union")
也可以对数据利用不同的条件过滤
m1 = make_comb_mat(lt, min_set_size = 7) # 去除数据少于7的set

m2 = make_comb_mat(lt, top_n_sets = 2) # 保留set最大的前2个

m3 = make_comb_mat(lt, universal_set = letters[1:10]) # 所有set中只保留前10个字母的元素

m4 = make_comb_mat(lt, complement_size = 5) # 所有集合的补集的大小
6.4 Utility functions
实用小工具环节,知道有这些函数即可,具体有啥用处,后面都会举例说明。
m = make_comb_mat(lt)
set_name(m) # 集合名

comb_name(m) # 组合的集合名

set_size(m)
comb_size(m)
comb_degree(m) # 组合中包含的及集合数

extract_comb(m, "101") # 提取指定组合里面的元素
用基因组的例子解释 extract_comb 的作用,在数据过大时就可以用这些函数来进行提取查看等一系列必须的操作。
library(circlize)
library(GenomicRanges)
lt2 = lapply(1:4, function(i) generateRandomBed())
lt2 = lapply(lt2, function(df) GRanges(seqnames = df[, 1],
                                       ranges = IRanges(df[, 2], df[, 3])))
names(lt2) = letters[1:4]
m = make_comb_mat(lt2)
set_size(m)
comb_size(m)
extract_comb(m, "1010")
6.5 Make the plot
m = make_comb_mat(lt)
UpSet(m) # 默认
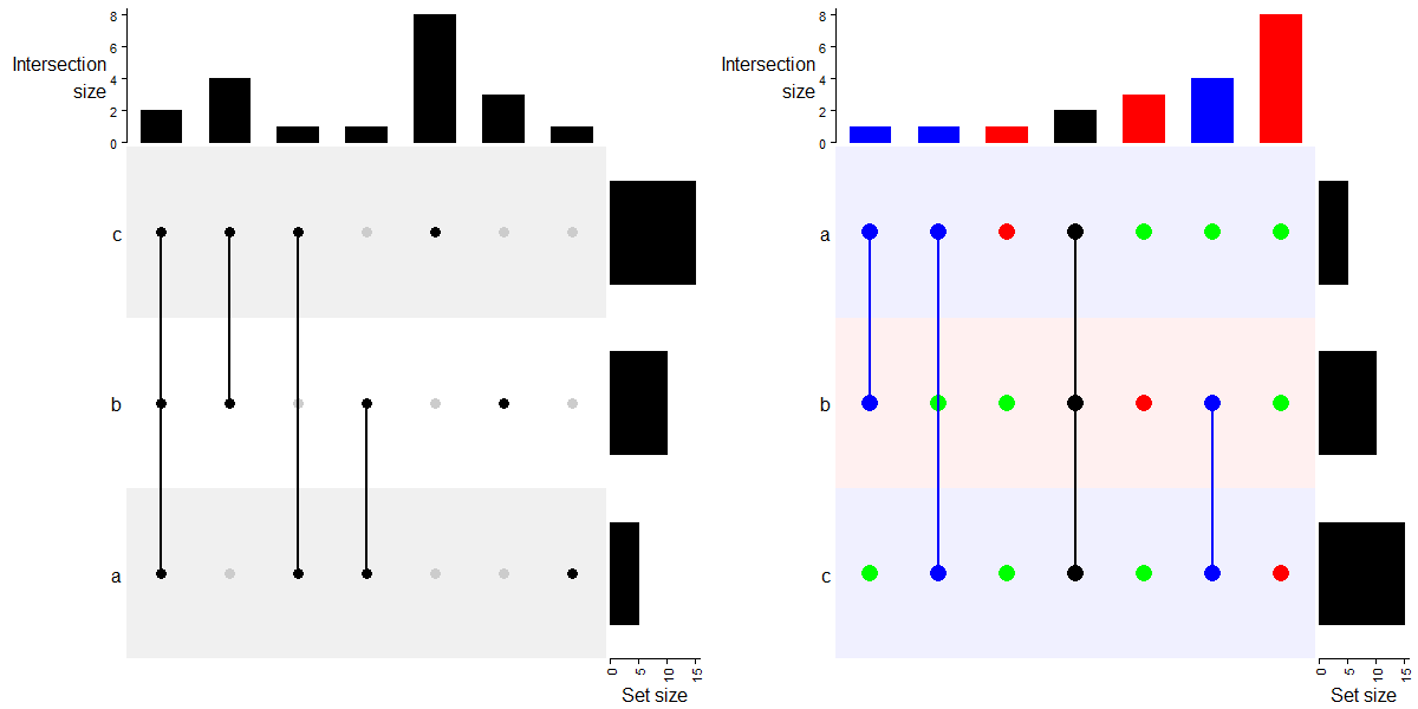
# 一些参数设置
UpSet(m,
pt_size = unit(5, "mm"), # 点大小
set_order = c("a", "b", "c"), # 集合排序
comb_order = order(comb_size(m)), # 组合排序
comb_col = c("red", "blue", "black")[comb_degree(m)], # 组合颜色
bg_pt_col = "green", #不在组合中的点颜色
bg_col = c("#F0F0FF", "#FFF0F0")) # 背景颜色一个或两个
下面的代码本质都是对前面数据进行处理,可以更好的理解前面那些函数的功用,自行按需组合使用即可。
UpSet(t(m)) # 转置图形

UpSet(m[comb_size(m) >= 4])
UpSet(m[comb_degree(m) == 2])
m1 = make_comb_mat(lt) # the default mode is `distinct`

m2 = make_comb_mat(lt, mode = "intersect")
m3 = make_comb_mat(lt, mode = "union")
UpSet(m1)
UpSet(m2)
UpSet(m3)
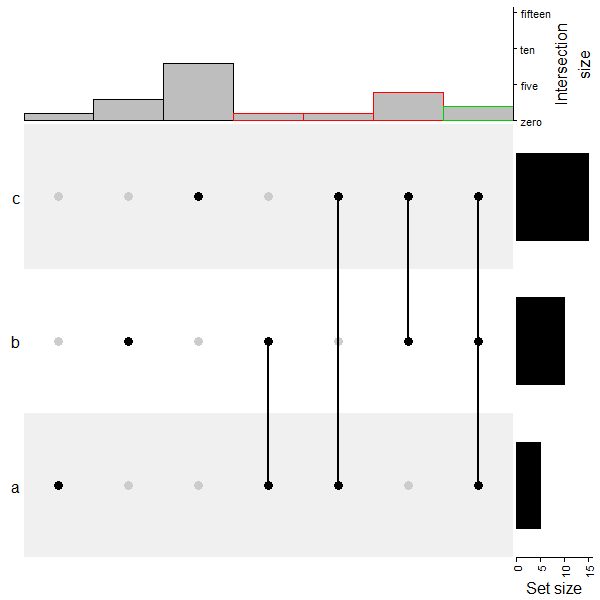
使用 upset_top_annotation 修改顶部注释,还可以使用 upset_right_annotation 修改右边的注释。
UpSet(m, comb_order = order(comb_degree(m)),
      top_annotation =
        upset_top_annotation(m, # 修改顶部注释

                             gp = gpar(col = comb_degree(m), # 按照comb_degree对边框着色

                                       fill = "gray"), # 填充色

                             axis_param = list(side = "right", # 坐标轴位置('left', 'right', 'top' and 'bottom')

                                               at = c(0, 5, 10, 15), # 刻度

                                               labels = c("zero", "five", "ten", "fifteen")), # 刻度标记

                             annotation_name_rot = 90, # 注释名角度(0, 90, 180, 270)

                             annotation_name_side = "right",
                             ylim = c(0, 15), # y轴范围

                             bar_width = 1), # 柱体宽度

      )
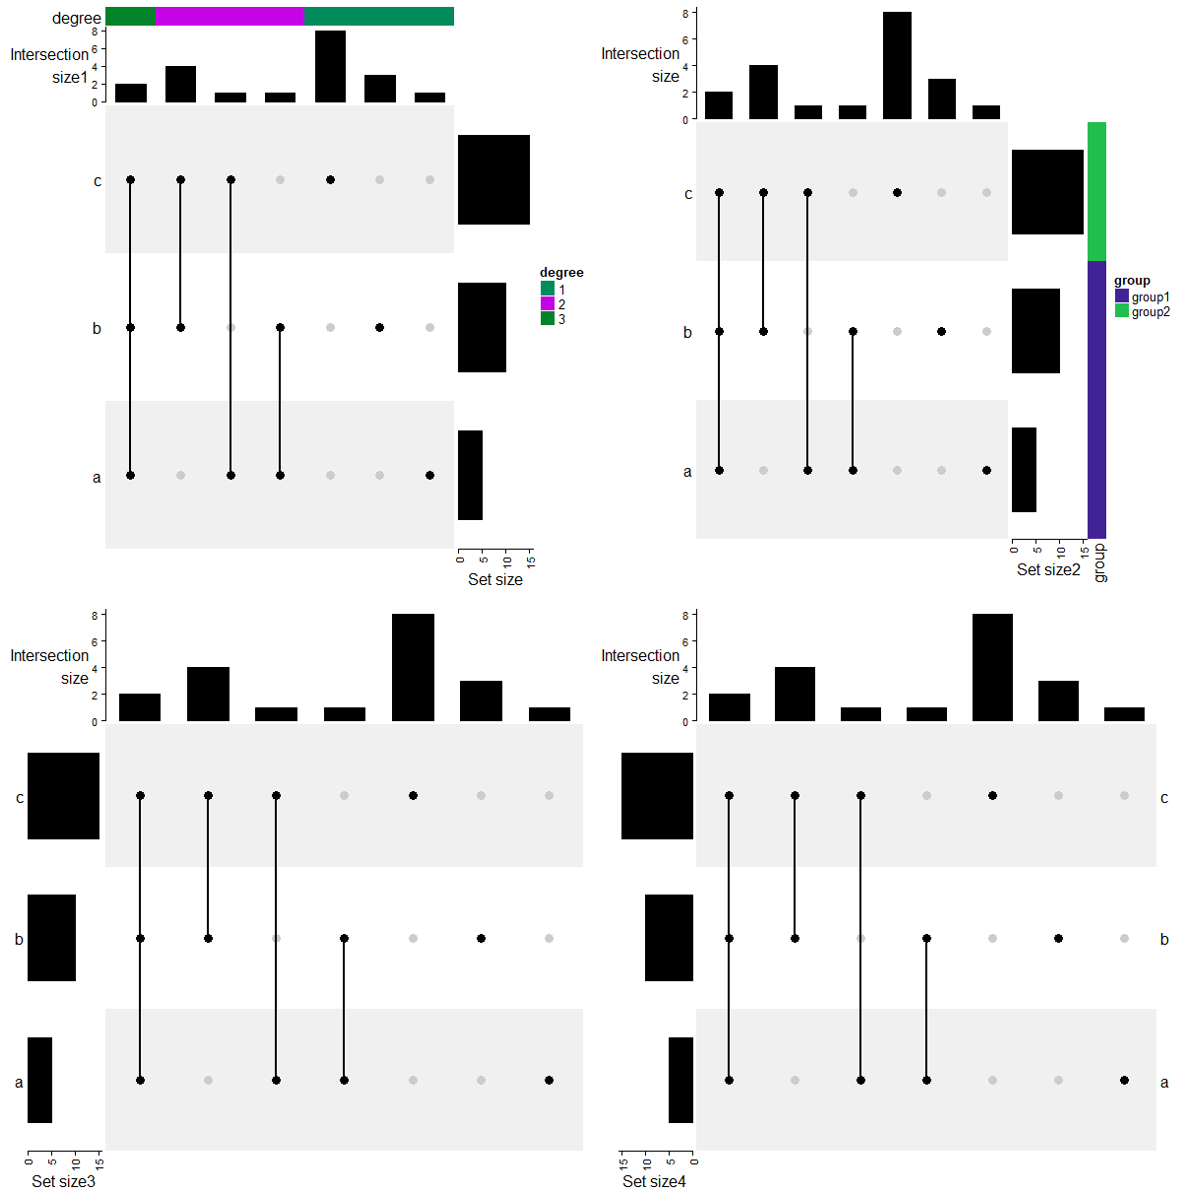
利用 HeatmapAnnotation 增加额外的注释,下面的代码就比较魔幻了,注意消化。
UpSet(m, top_annotation = HeatmapAnnotation(
  degree = as.character(comb_degree(m)),
  "Intersection\nsize1" = anno_barplot(comb_size(m),
                                      border = FALSE,
                                      gp = gpar(fill = "black"),
                                      height = unit(2, "cm")
  ),
  annotation_name_side = "left",
  annotation_name_rot = 0))

UpSet(m, right_annotation = rowAnnotation(
  "Set size2" = anno_barplot(set_size(m),
                            border = FALSE,
                            gp = gpar(fill = "black"),
                            width = unit(2, "cm")
  ),
  group = c("group1", "group1", "group2")))


UpSet(m, left_annotation = rowAnnotation(
  "Set size3" = anno_barplot(set_size(m),
                            border = FALSE,
                            gp = gpar(fill = "black"),
                            width = unit(2, "cm")
  )), right_annotation = NULL)


UpSet(m, left_annotation = rowAnnotation(
  "Set size4" = anno_barplot(set_size(m),
                            axis_param = list(direction = "reverse"),
                            border = FALSE,
                            gp = gpar(fill = "black"),
                            width = unit(2, "cm")
  )), right_annotation = NULL,
  row_names_side = "right")
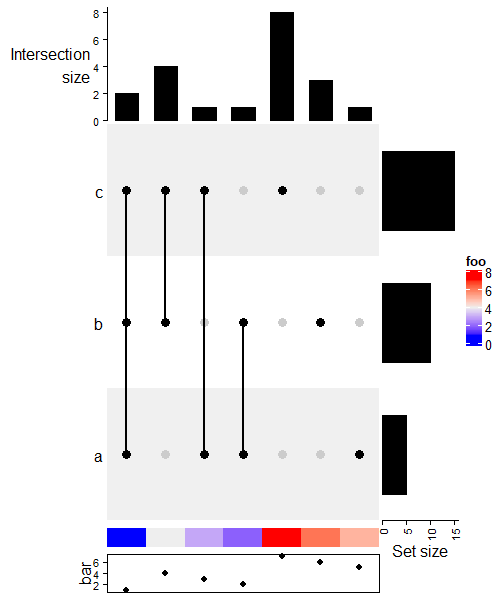
当然也是可以和热图进行组合的。
ht = UpSet(m)
ht + Heatmap(1:3, name = "foo", width = unit(5, "mm")) +
  rowAnnotation(bar = anno_points(1:3))


ht %v% Heatmap(rbind(1:7), name = "foo", row_names_side = "left",
               height = unit(5, "mm")) %v%
  HeatmapAnnotation(bar = anno_points(1:7),
                    annotation_name_side = "left")
m1 = make_comb_mat(lt, mode = "distinct")
m2 = make_comb_mat(lt, mode = "intersect")
m3 = make_comb_mat(lt, mode = "union")
UpSet(m1, row_title = "distinct mode") %v%
  UpSet(m2, row_title = "intersect mode") %v%
  UpSet(m3, row_title = "union mode")

# 利用 anno_lines 达到上图能够反应三组数据的结果

ht = UpSet(m1, top_annotation = HeatmapAnnotation(size = anno_lines(
  cbind(comb_size(m1), comb_size(m2), comb_size(m3)),
  gp = gpar(col = 2:4), height = unit(3, "cm")
)))
# you need to manually construct a legend

draw(ht, annotation_legend_list = list(Legend(
  title = "mode",
  type = "lines",
  labels = c("distinct", "intersect", "union"),
  legend_gp = gpar(col = 2:4)
))
)
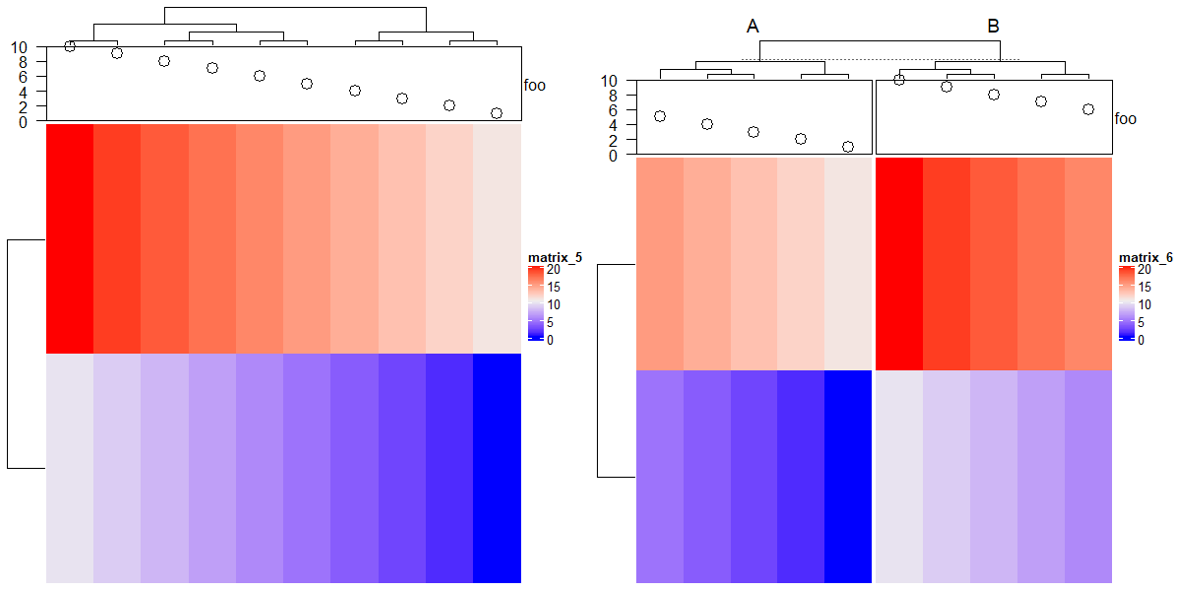
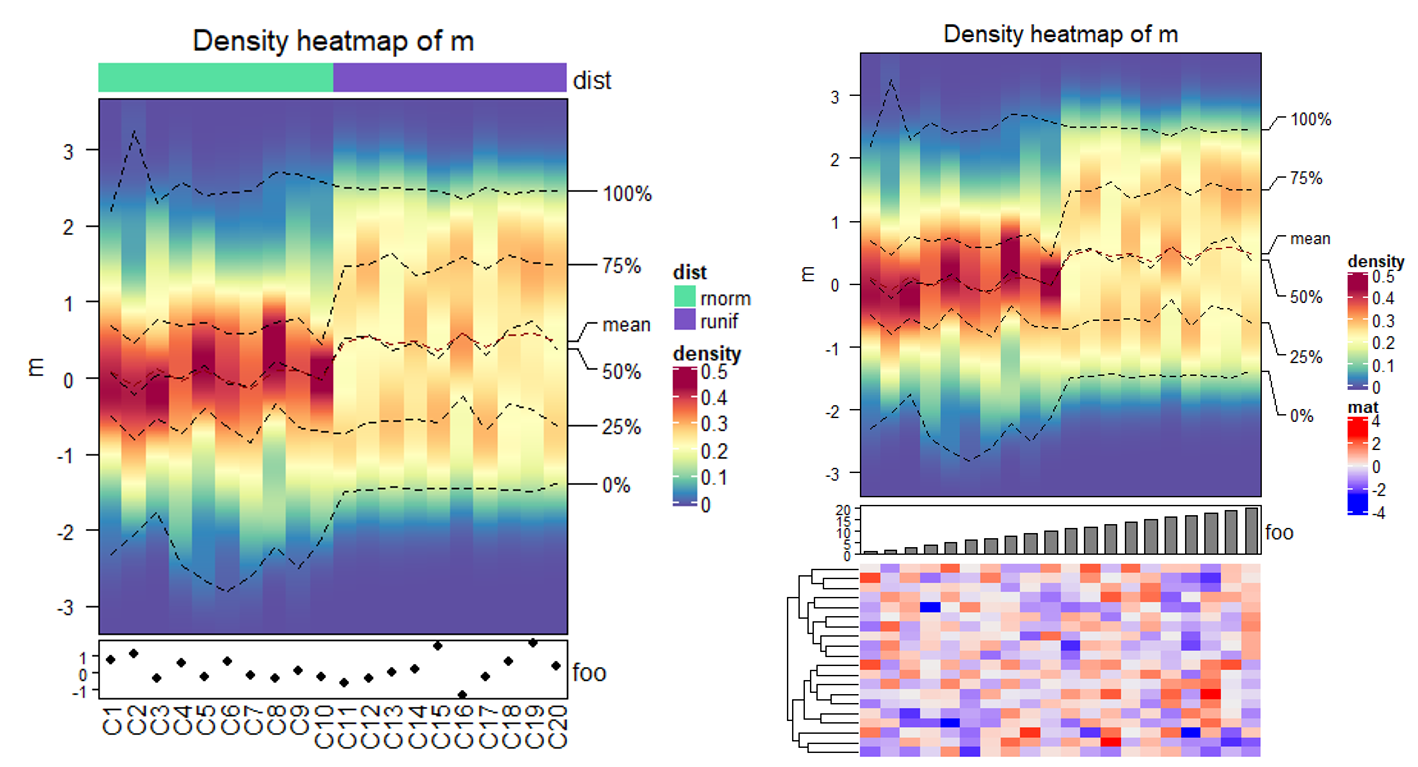
7 Density heatmap
set.seed(123)
m = cbind(matrix(rnorm(10*100), ncol = 10),
          matrix(runif(10*100, min = -2, max = 2) + 0.5, ncol = 10))
colnames(m) = paste0("C", 1:ncol(m))
# 默认效果

densityHeatmap(m)

# 配置参数

densityHeatmap(m,
               col = topo.colors(10), # 颜色

               # column_order = sample(20, 20), # 列重排序

               cluster_columns = TRUE, # 列聚类

               clustering_distance_columns = "ks", #列距离计算方法

               title = "Distribution as heatmap", # 标题

               ylim = c(-2, 2), # y轴范围

               ylab = "some values") # y轴标题

# 增加注释

ha1 = HeatmapAnnotation(dist = c(rep("rnorm", 10), rep("runif", 10)))
ha2 = HeatmapAnnotation(foo = anno_points(rnorm(20)))
densityHeatmap(m, top_annotation = ha1, bottom_annotation = ha2)

# 与热图组合

densityHeatmap(m) %v%
  HeatmapAnnotation(foo = anno_barplot(1:20)) %v%
  Heatmap(matrix(rnorm(20*20), ncol = 20), name = "mat", height = unit(4, "cm"))
8 More Examples
8.1 Add more information for gene expression matrix
rm(list = ls())
library(ComplexHeatmap)
library(circlize)

expr = readRDS(system.file(package = "ComplexHeatmap", "extdata", "gene_expression.rds"))
mat = as.matrix(expr[, grep("cell", colnames(expr))])
base_mean = rowMeans(mat)
mat_scaled = t(apply(mat, 1, scale))

type = gsub("s\\d+_", "", colnames(mat))
ha = HeatmapAnnotation(type = type, annotation_name_side = "left")

ht_list = Heatmap(mat_scaled, name = "expression", row_km = 5,
                  col = circlize::colorRamp2(c(-2, 0, 2), c("green", "white", "red")),
                  top_annotation = ha,
                  show_column_names = FALSE, row_title = NULL, show_row_dend = FALSE) +
  Heatmap(base_mean, name = "base mean",
          top_annotation = HeatmapAnnotation(summary = anno_summary(gp = gpar(fill = 2:6),
                                                                    height = unit(2, "cm"))),
          width = unit(15, "mm")) +
  rowAnnotation(length = anno_points(expr$length, pch = 16, size = unit(1, "mm"),
                                     axis_param = list(at = c(0, 2e5, 4e5, 6e5),
                                                       labels = c("0kb", "200kb", "400kb", "600kb")),
                                     width = unit(2, "cm"))) +
  Heatmap(expr$type, name = "gene type",
          top_annotation = HeatmapAnnotation(summary = anno_summary(height = unit(2, "cm"))),
          width = unit(15, "mm"))

ht_list = rowAnnotation(block = anno_block(gp = gpar(fill = 2:6, col = NA)),
                        width = unit(2, "mm")) + ht_list

draw(ht_list, ht_gap = unit(5, "mm"))
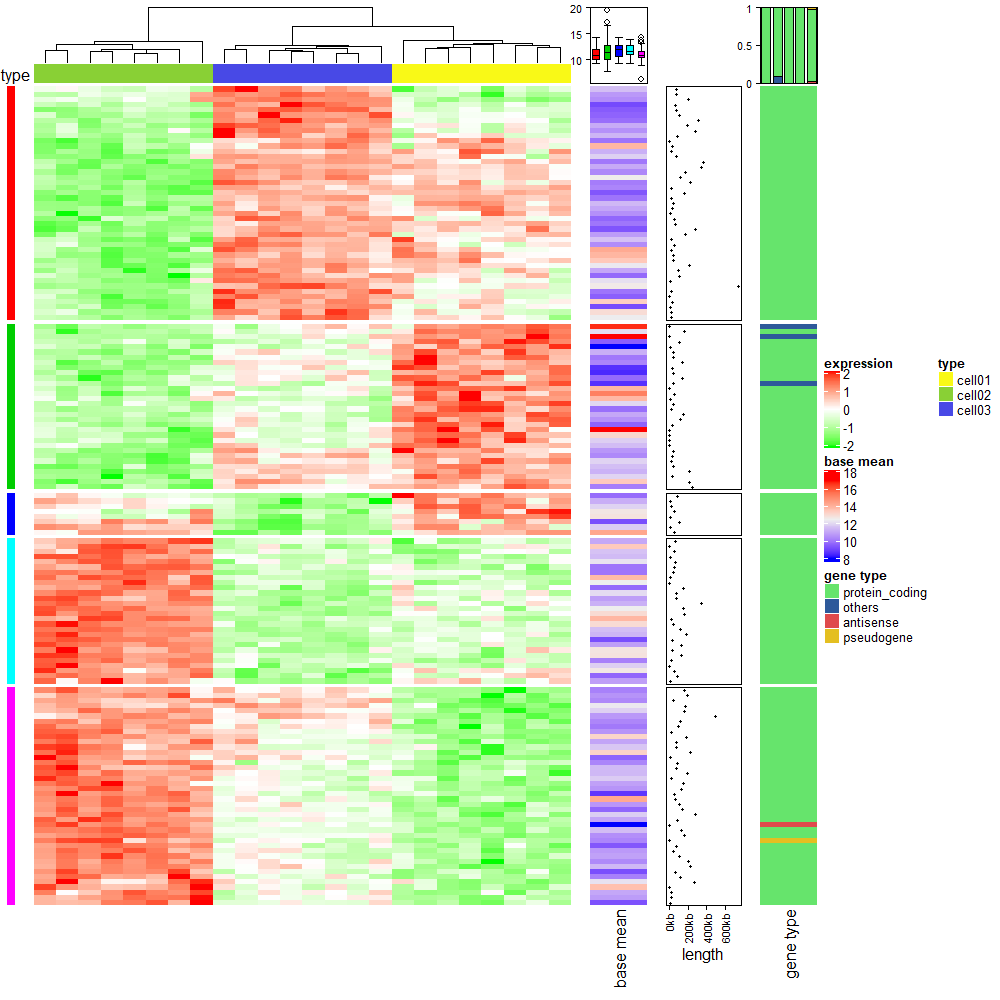
8.2 The measles vaccine heatmap
mat = readRDS(system.file("extdata", "measles.rds", package = "ComplexHeatmap"))
ha1 = HeatmapAnnotation(
  dist1 = anno_barplot(
    colSums(mat),
    bar_width = 1,
    gp = gpar(col = "white", fill = "#FFE200"),
    border = FALSE,
    axis_param = list(at = c(0, 2e5, 4e5, 6e5, 8e5),
                      labels = c("0", "200k", "400k", "600k", "800k")),
    height = unit(2, "cm")
  ), show_annotation_name = FALSE)
ha2 = rowAnnotation(
  dist2 = anno_barplot(
    rowSums(mat),
    bar_width = 1,
    gp = gpar(col = "white", fill = "#FFE200"),
    border = FALSE,
    axis_param = list(at = c(0, 5e5, 1e6, 1.5e6),
                      labels = c("0", "500k", "1m", "1.5m")),
    width = unit(2, "cm")
  ), show_annotation_name = FALSE)
year_text = as.numeric(colnames(mat))
year_text[year_text %% 10 != 0] = ""
ha_column = HeatmapAnnotation(
  year = anno_text(year_text, rot = 0, location = unit(1, "npc"), just = "top")
)
col_fun = circlize::colorRamp2(c(0, 800, 1000, 127000), c("white", "cornflowerblue", "yellow", "red"))
ht_list = Heatmap(mat, name = "cases", col = col_fun,
                  cluster_columns = FALSE, show_row_dend = FALSE, rect_gp = gpar(col= "white"),
                  show_column_names = FALSE,
                  row_names_side = "left", row_names_gp = gpar(fontsize = 8),
                  column_title = 'Measles cases in US states 1930-2001\nVaccine introduced 1961',
                  top_annotation = ha1, bottom_annotation = ha_column,
                  heatmap_legend_param = list(at = c(0, 5e4, 1e5, 1.5e5),
                                              labels = c("0", "50k", "100k", "150k"))) + ha2
draw(ht_list, ht_gap = unit(3, "mm"))
decorate_heatmap_body("cases", {
  i = which(colnames(mat) == "1961")
  x = i/ncol(mat)
  grid.lines(c(x, x), c(0, 1), gp = gpar(lwd = 2, lty = 2))
  grid.text("Vaccine introduced", x, unit(1, "npc") + unit(5, "mm"))
})
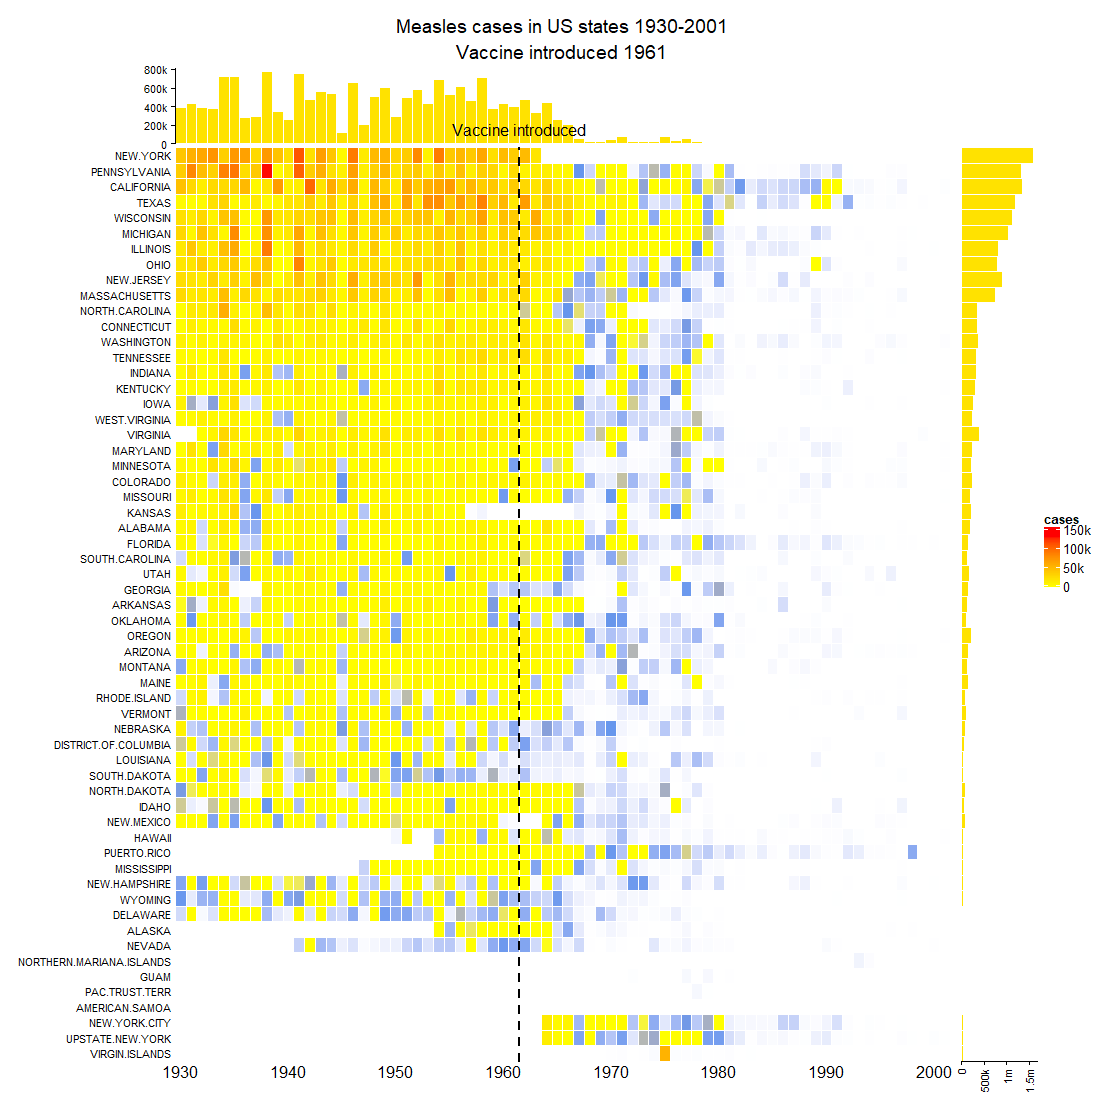
8.3 Visualize Cell Heterogeneity from Single Cell RNASeq
rm(list = ls())
library(ComplexHeatmap)

expr = read.table("mouse_scRNAseq_corrected.txt", sep = "\t", header = TRUE,row.names = 1)
expr = t(expr)

expr = expr[apply(expr, 1, function(x) sum(x > 0)/length(x) > 0.5), , drop = FALSE]

get_correlated_variable_genes = function(mat, n = nrow(mat), cor_cutoff = 0, n_cutoff = 0) {
  ind = order(apply(mat, 1, function(x) {
    q = quantile(x, c(0.1, 0.9))
    x = x[x < q[1] & x > q[2]]
    var(x)/mean(x)
  }), decreasing = TRUE)[1:n]
  mat2 = mat[ind, , drop = FALSE]
  dt = cor(t(mat2), method = "spearman")
  diag(dt) = 0
  dt[abs(dt) < cor_cutoff] = 0
  dt[dt < 0] = -1
  dt[dt > 0] = 1

  i = colSums(abs(dt)) > n_cutoff

  mat3 = mat2[i, ,drop = FALSE]
  return(mat3)
}

mat = get_correlated_variable_genes(expr, cor_cutoff = 0.5, n_cutoff = 20)
mat2 = t(apply(mat, 1, function(x) {
  q10 = quantile(x, 0.1)
  q90 = quantile(x, 0.9)
  x[x < q10] = q10
  x[x > q90] = q90
  scale(x)
}))
colnames(mat2) = colnames(mat)

cc = readRDS("mouse_cell_cycle_gene.rds")
ccl = rownames(mat) %in% cc
cc_gene = rownames(mat)[ccl]

rp = readRDS("mouse_ribonucleoprotein.rds")
rpl = rownames(mat) %in% rp

base_mean = rowMeans(mat)

library(GetoptLong)
ht_list = Heatmap(mat2, col = circlize::colorRamp2(c(-1.5, 0, 1.5), c("blue", "white", "red")),
                  name = "scaled_expr", column_title = qq("relative expression for @{nrow(mat)} genes"),
                  show_column_names = FALSE, width = unit(8, "cm"),
                  heatmap_legend_param = list(title = "Scaled expr")) +
  Heatmap(base_mean, name = "base_expr", width = unit(5, "mm"),
          heatmap_legend_param = list(title = "Base expr")) +
  Heatmap(rpl + 0, name = "ribonucleoprotein", col = c("0" = "white", "1" = "purple"),
          show_heatmap_legend = FALSE, width = unit(5, "mm")) +
  Heatmap(ccl + 0, name = "cell_cycle", col = c("0" = "white", "1" = "red"),
          show_heatmap_legend = FALSE, width = unit(5, "mm")) +
  rowAnnotation(link = anno_mark(at = which(ccl & base_mean > quantile(base_mean, 0.25)),
                                 labels = rownames(mat)[ccl & base_mean > quantile(base_mean, 0.25)],
                                 labels_gp = gpar(fontsize = 10), padding = unit(1, "mm"))) +
  Heatmap(cor(t(mat2)), name = "cor",
          col = circlize::colorRamp2(c(-1, 0, 1), c("green", "white", "red")),
          show_row_names = FALSE, show_column_names = FALSE, row_dend_side = "right",
          show_column_dend = FALSE, column_title = "pairwise correlation between genes",
          heatmap_legend_param = list(title = "Correlation"))
ht_list = draw(ht_list, main_heatmap = "cor")
decorate_column_dend("scaled_expr", {
  tree = column_dend(ht_list)$scaled_expr
  ind = cutree(as.hclust(tree), k = 2)[order.dendrogram(tree)]

  first_index = function(l) which(l)[1]
  last_index = function(l) { x = which(l); x[length(x)] }
  x1 = c(first_index(ind == 1), first_index(ind == 2)) - 1
  x2 = c(last_index(ind == 1), last_index(ind == 2))
  grid.rect(x = x1/length(ind), width = (x2 - x1)/length(ind), just = "left",
            default.units = "npc", gp = gpar(fill = c("#FF000040", "#00FF0040"), col = NA))
})
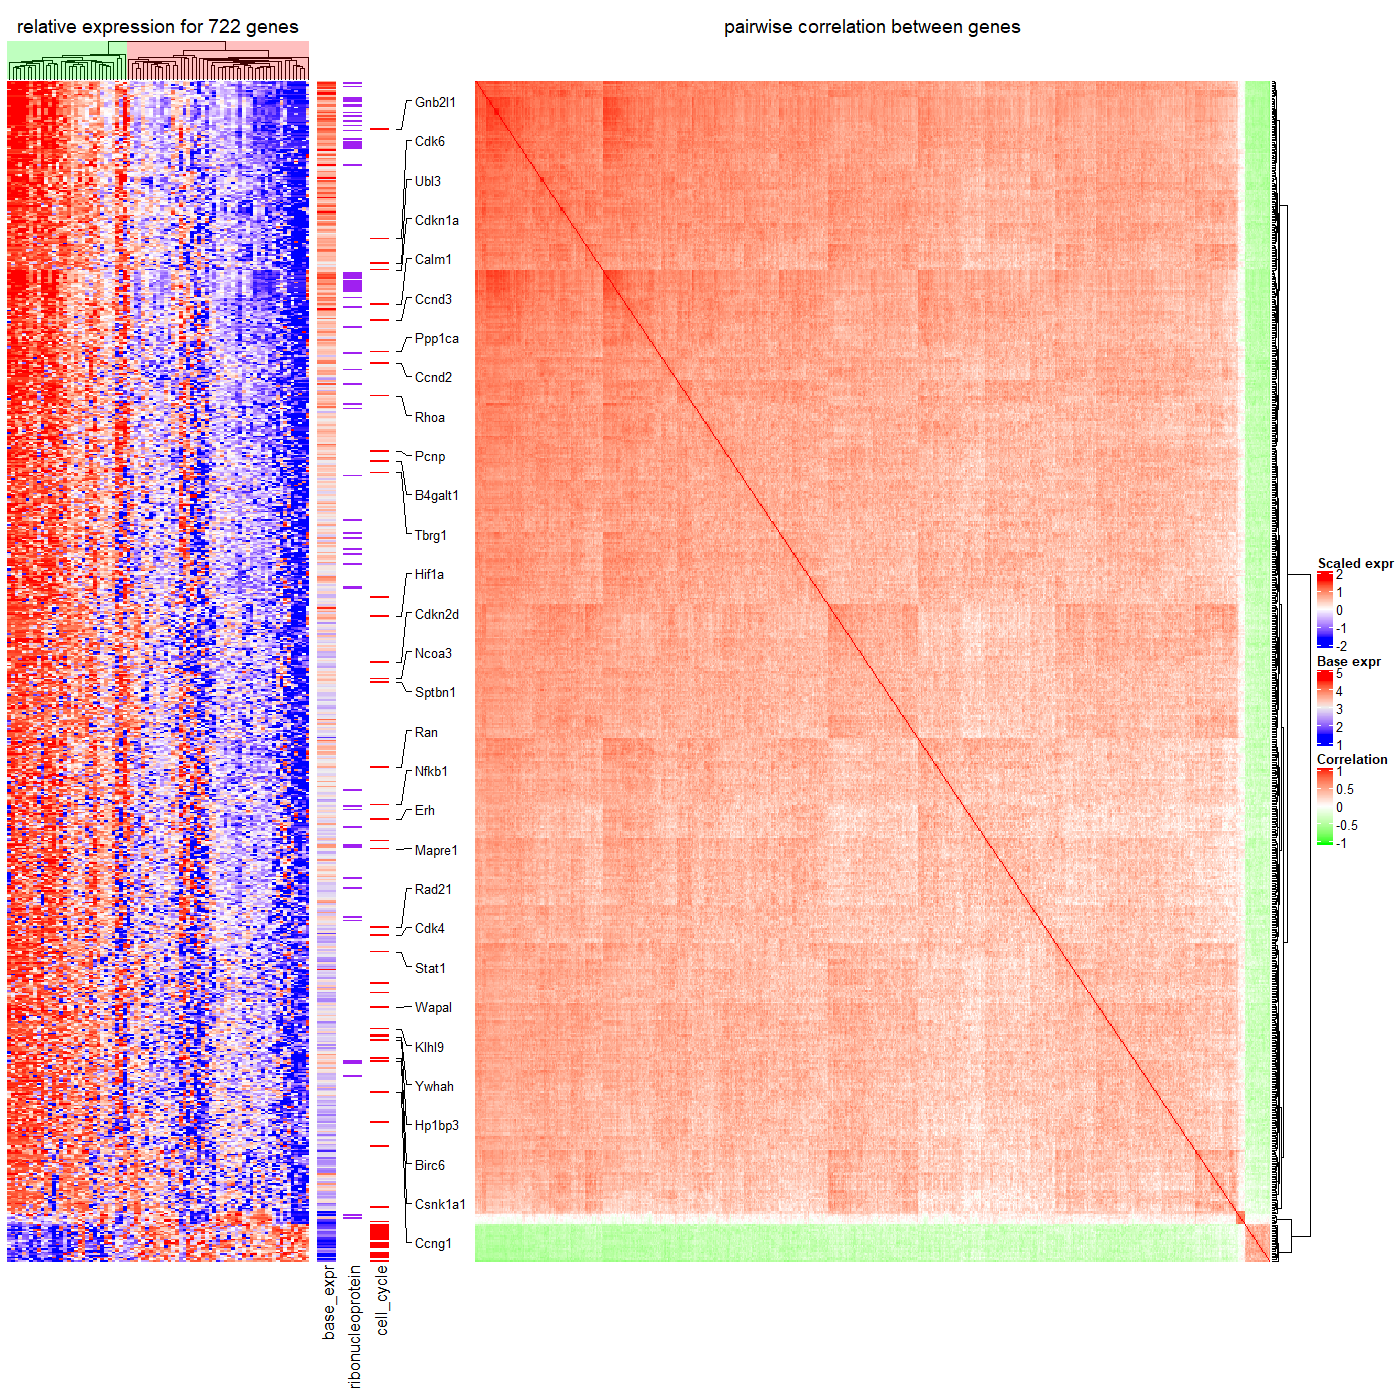
8.4 Correlations between methylation, expression and other genomic features
rm(list = ls())
library(ComplexHeatmap)

res_list = readRDS("meth.rds")
type = res_list$type
mat_meth = res_list$mat_meth
mat_expr = res_list$mat_expr
direction = res_list$direction
cor_pvalue = res_list$cor_pvalue
gene_type = res_list$gene_type
anno_gene = res_list$anno_gene
dist = res_list$dist
anno_enhancer = res_list$anno_enhancer


column_tree = hclust(dist(t(mat_meth)))
column_order = column_tree$order

library(RColorBrewer)
meth_col_fun = circlize::colorRamp2(c(0, 0.5, 1), c("blue", "white", "red"))
direction_col = c("hyper" = "red", "hypo" = "blue")
expr_col_fun = circlize::colorRamp2(c(-2, 0, 2), c("green", "white", "red"))
pvalue_col_fun = circlize::colorRamp2(c(0, 2, 4), c("white", "white", "red"))
gene_type_col = structure(brewer.pal(length(unique(gene_type)), "Set3"),
                          names = unique(gene_type))
anno_gene_col = structure(brewer.pal(length(unique(anno_gene)), "Set1"),
                          names = unique(anno_gene))
dist_col_fun = circlize::colorRamp2(c(0, 10000), c("black", "white"))
enhancer_col_fun = circlize::colorRamp2(c(0, 1), c("white", "orange"))


ht_opt(
  legend_title_gp = gpar(fontsize = 8, fontface = "bold"),
  legend_labels_gp = gpar(fontsize = 8),
  heatmap_column_names_gp = gpar(fontsize = 8),
  heatmap_column_title_gp = gpar(fontsize = 10),
  heatmap_row_title_gp = gpar(fontsize = 8)
)

ha = HeatmapAnnotation(type = type,
                       col = list(type = c("Tumor" = "pink", "Control" = "royalblue")),
                       annotation_name_side = "left")
ha2 = HeatmapAnnotation(type = type,
                        col = list(type = c("Tumor" = "pink", "Control" = "royalblue")),
                        show_legend = FALSE)

ht_list = Heatmap(mat_meth, name = "methylation", col = meth_col_fun,
                  column_order= column_order,
                  top_annotation = ha, column_title = "Methylation") +
  Heatmap(direction, name = "direction", col = direction_col) +
  Heatmap(mat_expr[, column_tree$order], name = "expression",
          col = expr_col_fun,
          column_order = column_order,
          top_annotation = ha2, column_title = "Expression") +
  Heatmap(cor_pvalue, name = "-log10(cor_p)", col = pvalue_col_fun) +
  Heatmap(gene_type, name = "gene type", col = gene_type_col) +
  Heatmap(anno_gene, name = "anno_gene", col = anno_gene_col) +
  Heatmap(dist, name = "dist_tss", col = dist_col_fun) +
  Heatmap(anno_enhancer, name = "anno_enhancer", col = enhancer_col_fun,
          cluster_columns = FALSE, column_title = "Enhancer")

draw(ht_list, row_km = 2, row_split = direction,
     column_title = "Comprehensive correspondence between methylation, expression and other genomic features",
     column_title_gp = gpar(fontsize = 12, fontface = "bold"),
     merge_legends = TRUE, heatmap_legend_side = "bottom")

ht_opt(RESET = TRUE)
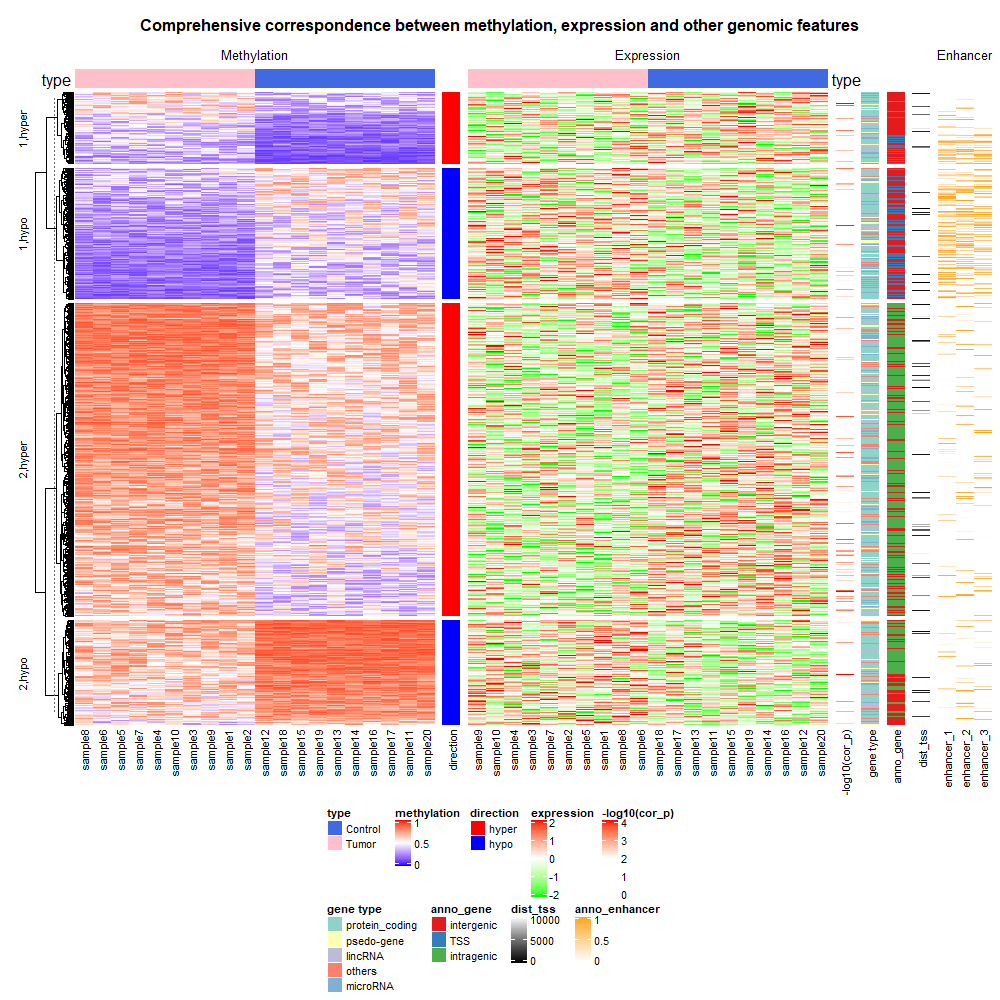
8.5 Add multiple boxplots for single row
m1 = matrix(sort(rnorm(100)), 10, byrow = TRUE)
m2 = matrix(sort(rnorm(100), decreasing = TRUE), 10, byrow = TRUE)
nr = nrow(m1)

ht_list = Heatmap(m1, name = "m1") + Heatmap(m2, name = "m2")

rg = range(c(m1, m2))
rg[1] = rg[1] - (rg[2] - rg[1])* 0.02
rg[2] = rg[2] + (rg[2] - rg[1])* 0.02
anno_multiple_boxplot = function(index) {
  pushViewport(viewport(xscale = rg, yscale = c(0.5, nr + 0.5)))
  for(i in seq_along(index)) {
    grid.rect(y = nr-i+1, height = 1, default.units = "native")
    grid.boxplot(m1[ index[i], ], pos = nr-i+1 + 0.2, box_width = 0.3,
                 gp = gpar(fill = "red"), direction = "horizontal")
    grid.boxplot(m2[ index[i], ], pos = nr-i+1 - 0.2, box_width = 0.3,
                 gp = gpar(fill = "green"), direction = "horizontal")
  }
  grid.xaxis()
  popViewport()
}

ht_list = ht_list + rowAnnotation(boxplot = anno_multiple_boxplot, width = unit(4, "cm"),
                                  show_annotation_name = FALSE)
lgd = Legend(labels = c("m1", "m2"), title = "boxplots",
             legend_gp = gpar(fill = c("red", "green")))
draw(ht_list, padding = unit(c(20, 2, 2, 2), "mm"), heatmap_legend_list = list(lgd))
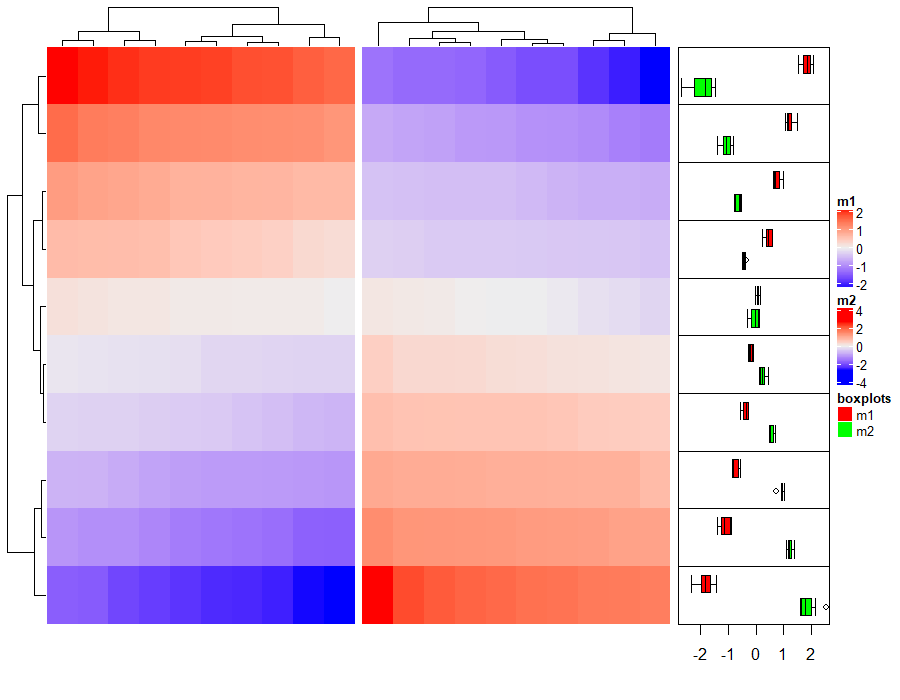
参考资料:
1.ComplexHeatmap Complete Reference
2.【r<-包】ComplexHeatmap(1):介绍
3.【r<-包】ComplexHeatmap(2):创建一个简单的热图
4.【r<-包】ComplexHeatmap(3):创建热图列表
5.【r<-包】ComplexHeatmap(4):热图注释
6.【r<-包】ComplexHeatmap(5):热图和注释图例
7.使用ComplexHeatmap包绘制热图
8.ComplexHeatmap包更新支持pheatmap转换